Editor’s note: Seeking Alpha is proud to welcome Rishi Prakash as a new contributor. It’s easy to become a Seeking Alpha contributor and earn money for your best investment ideas. Active contributors also get free access to SA Premium. Click here to find out more »
Bet_Noire/iStock via Getty Images
Thesis
With sanctions on Russian energy, the world’s largest oil exporter and third-largest producer, oil inventories are expected to be in short supply until the crisis has been resolved or feasible alternate solutions are found. However, despite the recent large release of oil from various strategic reserves, long-term solutions will not be easy or quick to achieve. As a result, unless there is a swift resolution to the conflict and Russian energy returns to the market, I expect oil prices to remain trading in the $100-$120 range during 2022, and gradually drop to $90’s in 2023.
EPS growth in this cyclical energy sector has been one of the fastest, with dividends increasing by 50% on average since 2018. Devon Energy (NYSE:DVN) – with its annualized dividend yield of 6.51%, a healthy balance sheet, aggressive share repurchase programs, and dividend payouts – has been performing better than its peers on almost all of the metrics considered. I recommend Devon Energy as a “Buy”.
Company Results
Devon announced on February 14th its highest ever fixed-plus-variable dividend of $1.00/share based for Q4 2021. Operating cash flow “OCF” increased 3x to $4.9b during FY21. This large OCF funded all Capex requirements and resulted in $2.9bn of Free Cash Flow “FCF” for Q4 ’21, an all-time high for DVN’s 50-year history. Results can be attributed primarily to the high production growth and margin expansions in their largest asset, the Delaware Basin.
Asset-wise performance during FY21:
- Delaware Basin – Drove Q4 performance with its high-margin production growth which increased by 34% during FY2021.
- Anadarko Basin – Per-well Capex from activity reduced in 2021 by 25%, driven by completion designs improvements and de-spacing of development units
- Devon’s Williston Basin, Eagle Ford & Power River Basin assets all recorded marginal improvements in cost structures and productivity.
The benefits of an oil-weighted production mix, together with low operating costs, have led cash margins to increase to $42.37m/Boe in Q4, which is a 14% improvement QoQ. For 2022, the company expects its product-wise output to be oil-heavy at ~50%, with gas and NGL contributing ~25% each.
The company also announced its next step in its cash-return strategy with an increased $1.6B Share-Repurchase program. This is equivalent to ~5% of Devon’s current market cap. The company’s accumulating cash balance will therefore be put to use in returning value to shareholders. It is important to note here that the company’s free cash flow will be first used to distribute its quarterly fixed dividends, with 50% of the remaining cash flow to be used for variable dividends. The remaining free cash flow will be then deployed towards the repurchase program.
Financials
Devon has been focusing on deleveraging its corporate profile and retired $1.2b of its outstanding debt in 2021. The company is targeting a Net Debt-EBITDA ratio of <0.5 by Q4’22 (from its current Q4’21 0.8x ratio), and also intends to further retire its low-premium debt of around $1bn in 2022 and 2023.
With $2.3bn cash on hand, a quick ratio of 1.21, and a Net Debt-EBITDA of 0.8x, the company has a very healthy balance sheet and strong financial position.
If WTI prices stabilize around $85 or higher during FY2022, Devon’s FCF is projected to grow by 70% YoY with a 14% FCF yield.
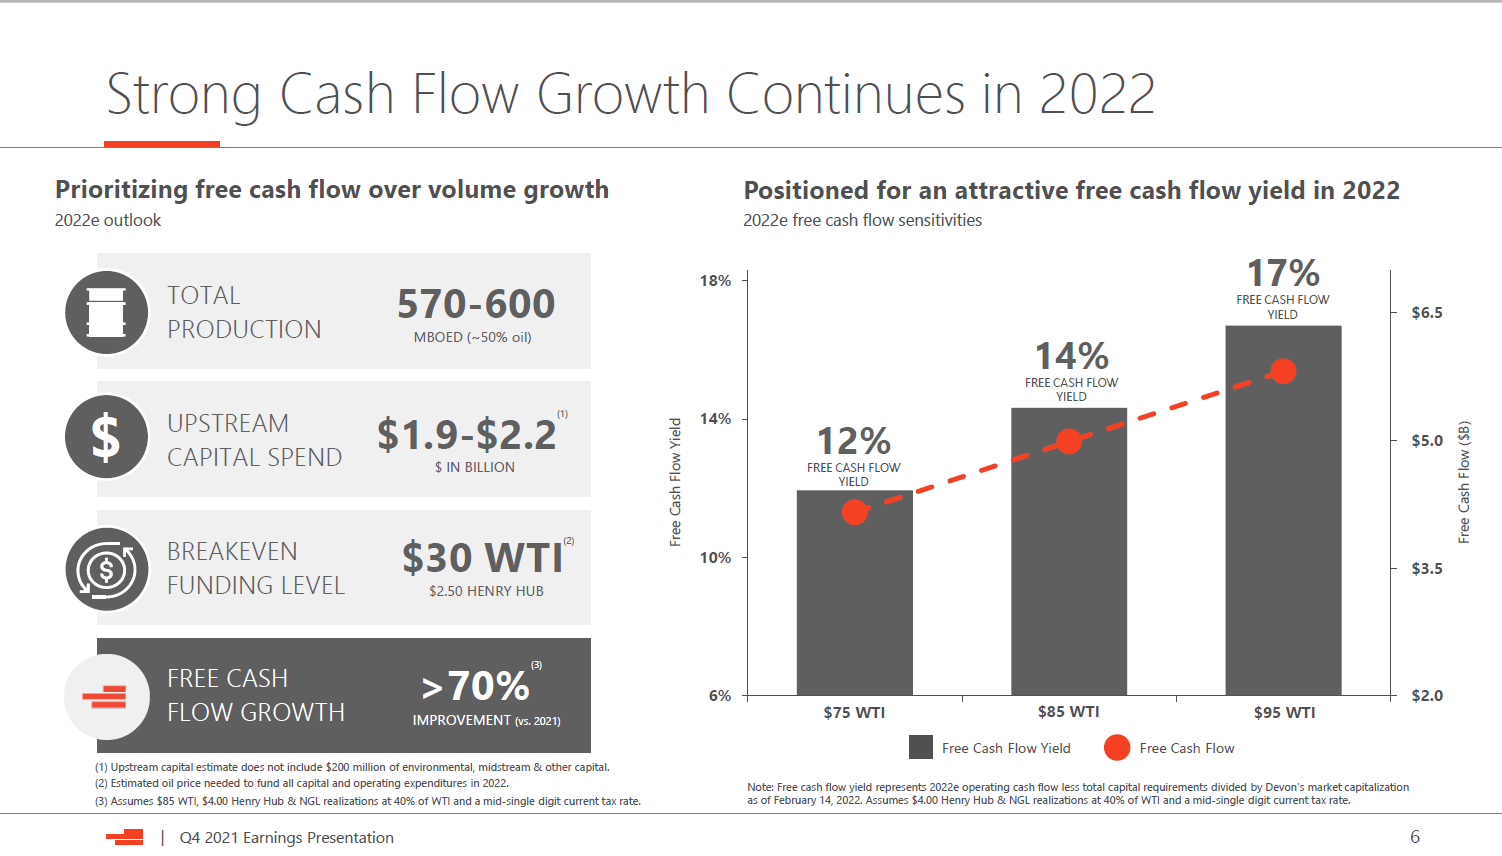
Devon Energy Earnings Report, Q4 ’21
Venturing into Renewables
Omnia Midstream Partners, a specialist in creating sustainable environmental solutions for upstream and midstream energy firms, has partnered with Devon Energy through a Joint Venture to develop and integrate renewable energy into its Delaware Basin field operations; details of this JV are mentioned below:
The project integrates the latest photovoltaic and battery technologies into the company’s upstream oil and gas operations to reduce emissions and improve efficiency across the business. Design of the project incorporates American made solar panels, inverters, and battery storage to support dynamic power demand on the company’s private electric grid. Moreover, the design incorporates data generated from Devon’s existing platforms, then utilizes predictive analytics and insights to ensure that the renewable energy is being put to efficient use; lowering costs and providing a competitive advantage for future growth.
This venture appears quite promising and can improve Devon Energy’s energy efficiency, expand its corporate ESG footprint, and further the company in meeting the industry target of net-zero GHG emissions by 2050.
Peer Group Performance
An LTM EV/EBITDA of 8.4x for Devon Energy appears quite undervalued for an Oil Exploration & Production company. But let us compare this with its peers to ascertain its relative valuation.
|
Market Valuation |
||||
|
Company |
LTM EV/EBITDA |
Fwd EV/EBITDA |
P/E |
Dividend Yield |
|
Devon Energy Corporation (DVN) |
8.4x |
6.0x |
14.5x |
6.51% |
|
Pioneer Natural Resources Company (PXD) |
12.0x |
7.0x |
29.2x |
0.99% |
|
EOG Resources, Inc. (EOG) |
6.7x |
5.4x |
15.1x |
2.45% |
|
Diamondback Energy, Inc. (FANG) |
7.2x |
5.9x |
11.2x |
1.72% |
|
Hess Corporation (HES) |
11.3x |
7.8x |
56.1x |
1.44% |
|
DCP Midstream (DCP) |
11.5x |
8.5x |
20.4x |
4.76% |
|
Halliburton Company (HAL) |
13.8x |
9.9x |
22.8x |
1.33% |
|
MEDIAN |
9.9x |
7.0x |
15.1x |
|
|
Performance Metrics |
||
|
Company |
ROE % |
ROA % |
|
Devon Energy Corporation |
45.6 |
18.2 |
|
Pioneer Natural Resources Company |
18.97 |
11.65 |
|
EOG Resources, Inc. |
21.96 |
12.6 |
|
Diamondback Energy, Inc. |
19.24 |
9.92 |
|
Hess Corporation |
11.61 |
2.84 |
|
DCP Midstream |
6.84 |
2.9 |
|
Halliburton Company |
16.51 |
4.49 |
Compared to its peer group, Devon Energy has a much more attractive dividend yield, and along with its significantly higher performance metrics, demonstrates that it is committed to returning cash to shareholders while maximizing its asset efficiency. The company has a more appealing relative valuation as well, with its forward EV/EBITDA at 6.0x and a 14.5x P/E ratio, supporting my thesis that Devon is an attractive energy company with solid fundamentals in this volatile oil market.
Devon Energy Valuation
Let’s also take a look at Devon’s intrinsic value through my 5Y Discounted Cash Flow “DCF” model below. Most of the assumptions used here are industry standard and self-explanatory.
| Assumptions | |
| Tax Rate | 17.9% |
| Rf (5Y US Treasury) | 2.42% |
| Market Risk Premium | 4.4% |
| 5Y Beta | 2.1 |
| Adjusted Market Risk Premium | 7.0% |
| Cost of Equity | 9.4% |
| Cost of Debt (Int Exp/BV of Debt) | 6.8% |
| After-Tax Cost of Debt | 5.6% |
| Debt/Equity | 16.8% |
| Weighted Cost of Equity | 8.1% |
| Weighted Cost of Debt | 0.8% |
| Weighted Average Cost of Capital “WACC” | 8.9% |
| Projected Cash Flows | 2022E | 2023E | 2024E | 2025E | 2026E |
| Revenue | 18,723 | 23,295 | 29,940 | 34,288 | 38,410 |
| EBITDA | 5,197 | 6,699 | 8,909 | 10,546 | 12,198 |
| Net Income | 409.2 | 782 | 1,356 | 1,954 | 6,638 |
| Unlevered FCF | 506 | 803 | 1,256 | 1,693 | 2,183 |
| Discount Rate | 0.76 | 1.75 | 2.75 | 3.75 | 4.75 |
| PV of Cash Flows | 358 | 692 | 993 | 1,230 | 1,456 |
The median forward EV/EBITDA multiple for Devon Energy’s comparables is 7.0x. Discounting this multiple by a percentage point, a terminal EBITDA multiple of 6.0x has been used to estimate Devon’s equity value. This assumption is in line with the industry EBITDA exit multiple benchmark of 6.2x for Oil E&P companies. We arrive at an intrinsic share price of $73.42 – implying a further 22% upside from the current $60.35 share price.
| Present Value of Equity at 1 April 2022 | |
| PV of 2022 Free Cash Flow Stub | 357.8 |
| PV of 2023-2026 Free Cash Flows | 4,371 |
| PV of Terminal Value | 48,835 |
| Enterprise Value “EV” | 53,564 |
| Less Total Debt | (6,760) |
| Less Minority Interest | (137) |
| Plus Cash & Equivalents | 2,099 |
| Equity Value | 48,767 |
| Shares Outstanding | 664.2 |
| Intrinsic Share Value | 73.42 |
| Current Price | 60.35 |
Share Price History
Devon’s share price has been increasing steadily from $21 to $60.35, an increase of 187% over the last 12 months. This movement has been largely in tandem with the increase in oil prices (see graph below).
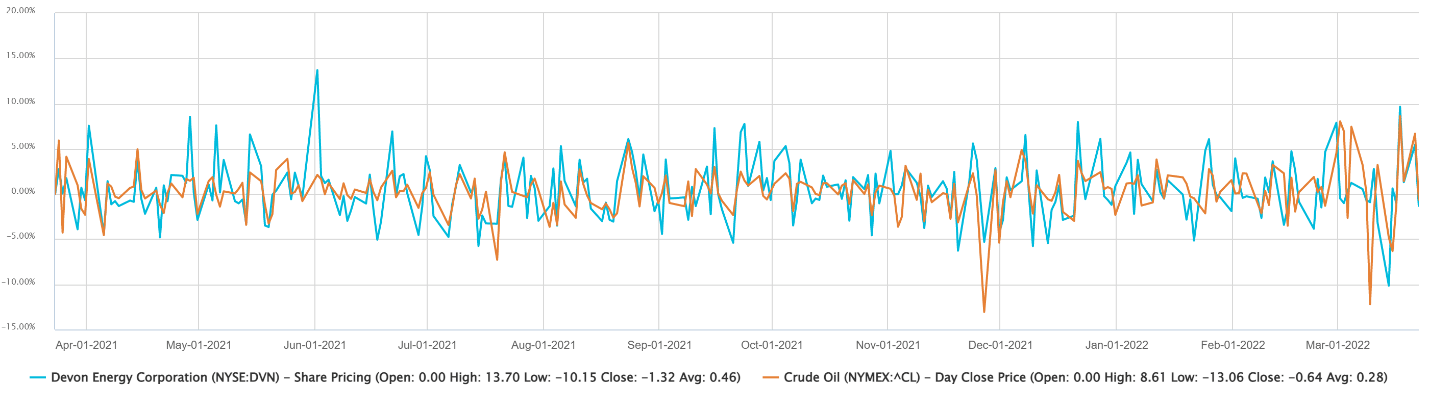
Capital IQ Database
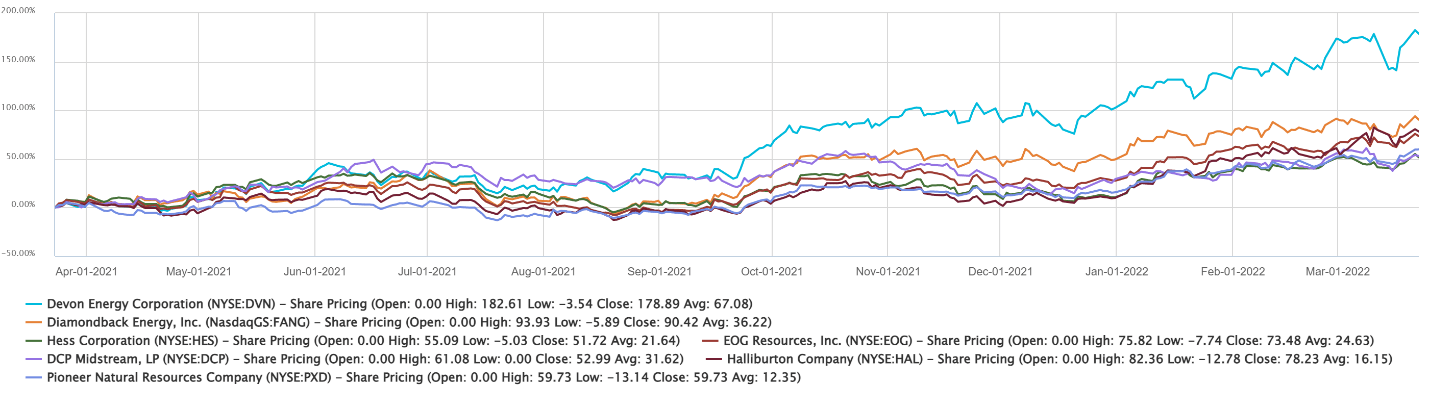
Capital IQ Database
And as you can see above, Devon’s peers’ share prices have lagged behind, having increased by only 52% to 90% during the same 12-month period.
Key Risks
Two key risks that should be taken into consideration however include:
A surge in COVID-19 cases could result in a drastic reduction in oil demand
While COVID cases of the new subvariant are surging across Asia once again, the effect on oil demand appears to be more subtle so far. As seen in the oil chart below, Brent prices have been steadily climbing up since December 2021 and broke stride only once in March to $98 before rising back to $120. The lower limit of Bollinger Bands indicates that prices are expected to remain at least above $97 in the short term. However, if governments begin to reimpose travel restrictions and lockdowns, we could expect air traffic reduction, uptick in remote working, and an exacerbation of supply-chain issues – all leading to another stint of depressed oil prices harming Devon’s profitability. However, Devon’s price-hedging activities should help the company mitigate some of this risk.
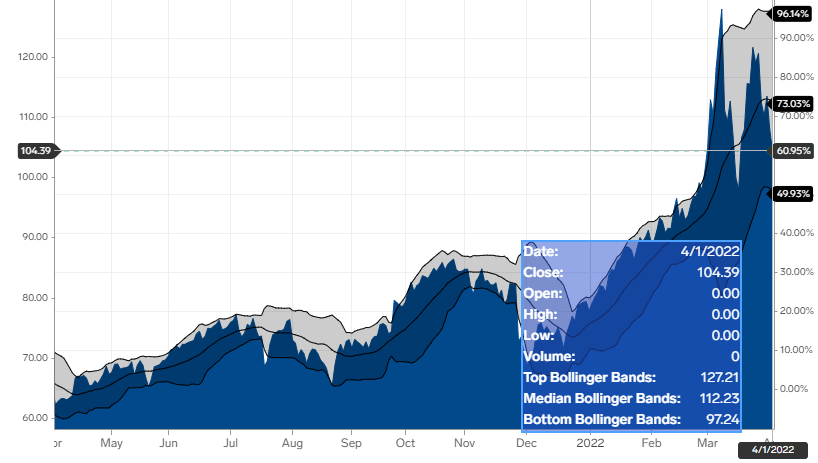
Brent Oil Prices (Business Insider)
OPEC+ agreeing to a coordinated further increase in production outputs
OPEC+ agreed to stay its course at a meeting on 31st March ’22 and approved to raise production by 430,000b/ for May, a modest increase from the previous MoM targeted increases of 400,000. However, some OPEC members such as Libya, Nigeria, and Angola have been consistently failing to meet their quota targets as per the new OPEC agreement, falling short of almost 1mn b/d. The Kingdom of Saudi Arabia and the United Arab Emirates are probably the only countries with the ability and excess capacity to quickly ramp up their oil production. However, they seem disinclined to increase production any further. The combined excess capacity of both countries would still be insufficient however to fill the void that the absence of 8mn b/d of Russian oil exports would create with ongoing sanctions (of which 3-4mn b/d are already sanctioned). I expect Russian refineries to also begin slowing their production in April due to self-sanctions and buyer aversions. On other fronts, even if a deal is struck with Iran, the country was only producing 4.3mn b/d of oil before the Trump sanctions, and I expect them to take considerable time in ramping up production to these levels again. Iran can also only export around 2mn b/d, as the rest would be consumed domestically.
The United States is also considering releasing 180mn barrels from its Strategic Petroleum Reserves “SPR”, about 1mn b/d for the next 6 months, to soothe the energy prices. The news sent oil prices temporarily dropping 4%, before climbing back up to close above $100. Investors likely pondered the real efficacy of this move, while factoring in this would not solve any long-term supply issues. Even before the invasion, I did believe oil was already on a trajectory to reach new highs in 2022 due to historic production cuts and very low inventories. This release from the SPR will further decrease global oil supply reserves to historical lows, prompting oil to trade near current levels for H1 2022, before stabilizing in the early $100 range during H2.
Conclusion
Based on my valuation model and analysis, Devon Energy is an Oil & Gas player with solid fundamentals that is still undervalued. While the share price has shot up over the past year, there still seems to be significant upside potential over the next 6-18 months, as it benefits from the higher oil and gas prices. Recommending Devon Energy today as a “Buy” with a price target of $73.4.