
masterSergeant/iStock via Getty Images
U.S. equities began the week with the DJIA down 650 points at close and at its lowest level since March 2021. Aside from the Dow, selling was broad based across all indexes and sectors. Even the stronger parts of the market, such as the energy sector, closed materially lower, with the S&P 500 energy sector down 8.3% at close, its worst one-day decline since June of 2020.
The selling pressures continued into Tuesday, despite a reprieve earlier in the day as investors began buying up shares of heavily beaten-down companies. While both the Nasdaq and the S&P closed higher, the gains were muted. The DJIA, on the other hand, finished 85 points lower, hitting a 52-week low.
Stocks continued to fall on Wednesday following the release of the Labor Department’s inflation report, which showed inflation declining to 8.3%, its first decline in eight months, but still higher than expectations. The decline came primarily from easing energy prices, but energy costs have since reached new highs. Additionally, though there was a decline in the overall inflation report, prices for services accelerated to its fastest one-month increase since 1990, cementing the belief that inflationary pressures are unlikely to cool in the near-term. In the crypto market, Bitcoin (BTC-USD) and other cryptocurrencies experienced significant downward pressure, following the collapse of TerraUSD (LUNA-USD).
The DJIA closed lower for a sixth consecutive day on Thursday, down just over 100 points at close. While the S&P and Nasdaq finished little changed, all three indexes were still on pace for weekly declines greater than 3%. On the data front, the producer-price index showed an annual rise of 11% in April, which was lower than the prior month, but still higher than expectations.
Indexes were set for a relief rally to end the week, with all three averages higher at pre-market trading. In individual names, Twitter (TWTR) dropped over 10% prior to market open on news that Elon Musk was placing his decision to purchase the company on a temporary hold. Additionally, shares in Robinhood (HOOD) surged over 20% after Sam Bankman-Fried disclosed he bought a nearly 8% stake in the brokerage.
The continued slide in the markets has presented attractive buying opportunities on a wide range of stocks. For income-focused investors seeking a long-term addition to their diversified portfolios, there are five laggards this week that would be a good fit for any long-term focused portfolio.
Lincoln National Corporation (LNC)
LNC operates multiple insurance and retirement businesses in four business segments: Annuities; Retirement Plan Services; Life Insurance; and Group Protection.
For the most recent quarter ended March 31, 2022, LNC reported total revenues of +$4.7B, which was just over 3% higher than the same period last year but +$110M shy of estimates. Additionally, non-GAAP EPS of $1.66 also missed by $0.16.
On the day of earnings, LNC declined about 2%. Since then, shares have come under heavy selling pressure. Over the past five days, LNC is down about 5%, while the broader market is down about 3%.

YCharts – LNC Price History
During the quarter, LNC generated +$753M in cash from operations and returned +$479M to shareholders in the form of dividends and buybacks. At over 1.5x coverage, the total payouts are safe.
In addition, the current dividend is yielding 3.4%, which is comparable to the yields during the crash of 2020 and just prior to 2008. The current outlook, however, is positive. LNC is expected to benefit from the recent decline in COVID-related hospitalizations and deaths and the rise in interest rates.

Seeking Alpha – LNC Dividend Growth History
At a 2.8% dividend yield, shares would be worth about $65, which would represent a forward P/E of about 7x. For a company that has a long track record of dividend increases, LNC near its 52-week lows is worth further examination.
The AES Corporation (AES)
AES is a global energy company that is an industry leader in developing sustainable energy solutions. They are organized into four market oriented SBUs: U.S. and Utilities; South America; Mexico, Central America, and the Caribbean (MCAC); and Europe and Asia (Eurasia).
In the current quarter, AES reported total revenues of +$2.9B, which was 8% more than last year and +$320M greater than expectations. Non-GAAP EPS of $0.21, however, did miss by $0.06 due partly to higher income taxes.
During the quarter, AES obtained an investment grade rating from Moody’s, which would now give them three such ratings from all three major reporting agencies. The company’s commercial structure, long-term dollar-denominated contracts, and the growth in the company’s utilities were all positive factors considered in the ratings upgrade.
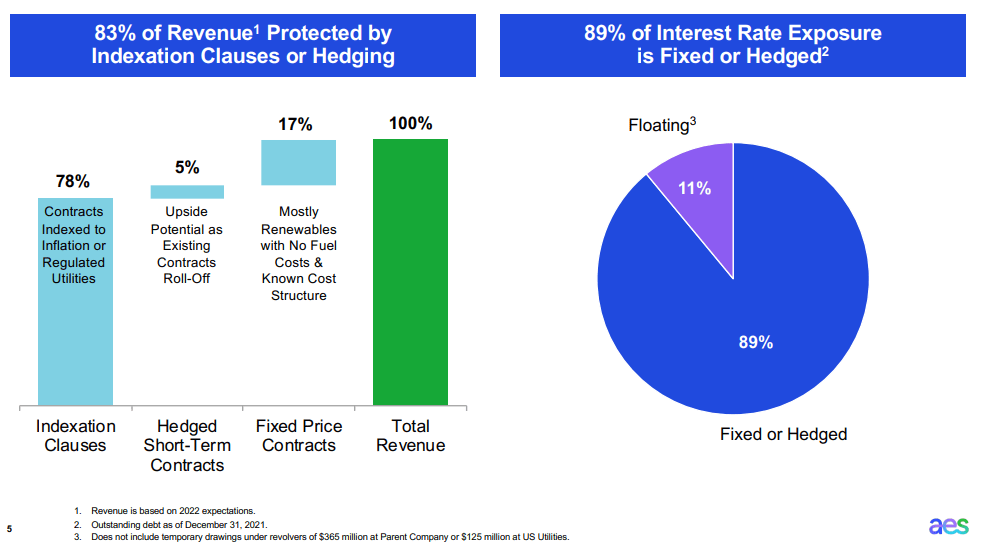
In addition to reaffirming their EPS guidance of between $1.55 and $1.65, management also reaffirmed their 7% to 9% annualized growth target through 2025. With 83% of revenues protected by indexation clauses or hedging, accomplishment of this target is attainable, considering the current inflationary environment.
AES Investor Day Presentation
Shares in AES are down to new 52-week lows this week and are trading at 1.2x sales. While the valuation is in-line with historical averages, it is discounted to the index, which currently trades at 2.7x sales. As a utility company with built-in escalators, AES would be a defensive addition to any portfolio. For those seeking protection at a discounted valuation, AES may be one to watch.
The Goldman Sachs Group, Inc. (GS)
GS is a leading global financial institution that reported +$59.4B in total revenues for the full year ended December 31, 2021, and +$12.9B in revenues during the first quarter of 2022. Additionally, the firm has +$1.6T in total assets.+$274B of these assets are held in cash and cash equivalents.
On their most recent earnings release, the firm reported a large beat on both revenues and EPS. Revenues came in +$1.2B more than expected and EPS beat by $1.78. While overall revenues were lower than in 2021, total revenues derived from the Consumer & Wealth Management segment were 21% higher. This is of note due to the emerging growth potential of the segment.
Following the release, shares rallied higher for a short period, reaching a one month high of $341.
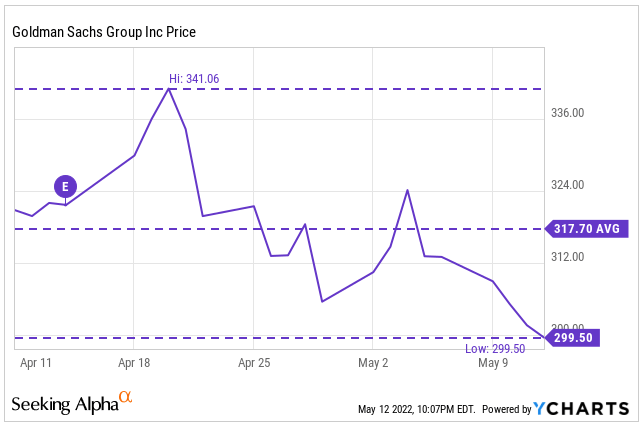
YCharts – GS Price History
Shares have since fallen well below their trading levels on the day of their quarterly release. At current valuations, there is still a wide gap between the price to book of GS and their related peers, such as JPMorgan Chase & Co. (JPM) and Morgan Stanley (MS). At a current dividend yield of 2.65% with a 5-YR CAGR of 23%, GS is one bank and DJIA component to look further into over the weekend.

YCharts – GS Price to Book Ratio Compared to Related Peers
The Home Depot, Inc. (HD)
HD is the world’s largest home retailer that is currently trading near their lows due to a combination of broader market fears and concerns regarding the outlook for housing. With rates steadily increasing and the rate on a 30-Year mortgage now above 5%, there are valid concerns that there will be a slowdown in the housing market.
Over the past ten years, HD has consistently outperformed the broader S&P, returning 22% versus a return of 13.5% for the index.
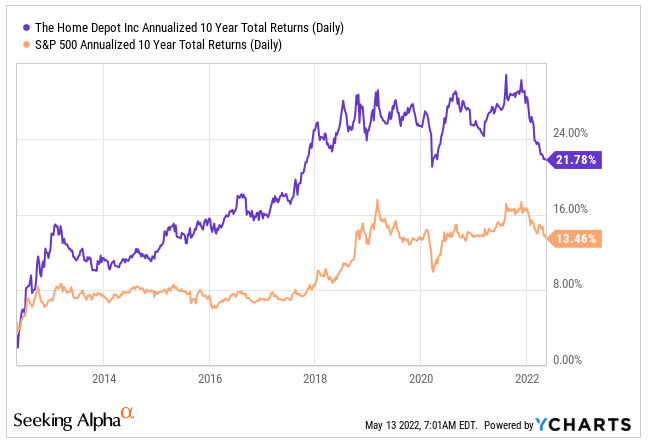
YCharts – HD Annualized 10-YR Returns Compared To S&P 500
YTD, however, HD is down about 30%, significantly worse than the S&P.
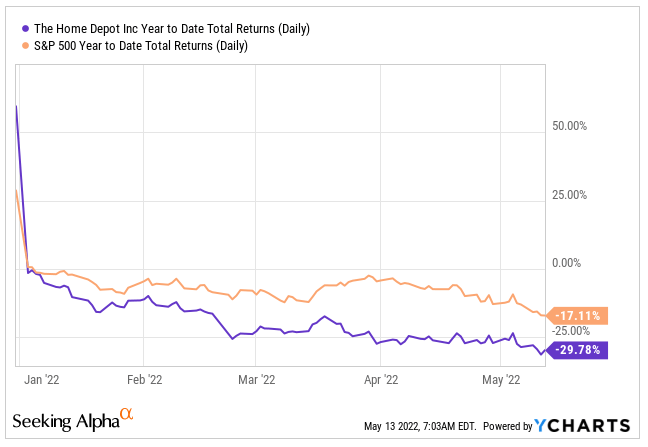
YCharts – HD YTD Returns Compared to S&P 500
Despite the fears of an impending slowdown, the outlook is supportive of continued growth in the repair and replace market. An aged housing stock and favorable demographic trends are two tailwinds for HD in 2022 and beyond. Additionally, record low supply will keep prices higher for longer even if demand wanes. This will benefit existing homeowners and allow them to tap into existing equity to fund larger projects that were put off during the past two years.
HD is set to report earnings on Tuesday, May 17, 2022. Revenue expectations are coming in at +$36.7B and EPS is expected to be $3.70. With shares at depressed levels, the stock would likely receive a bounce upon any beat or positive developments in guidance. For investors looking to add a solid retail company to their portfolio, HD is one to watch ahead of earnings.
Prudential Financial, Inc (PRU)
PRU is a financial services leader with about +$1.6T in assets under management (AUM) as of March 31, 2021. The company offers a wide variety of financial products and services, including life insurance, annuities, and retirement-related services, among others. These products and services are offered to individual and institutional customers through one of the largest networks in the industry.
In the current quarter, PRU reported earnings that surpassed expectations and provided favorable commentary and guidance. Also during the quarter, the company completed two key divestitures, which reduced the market sensitivity of their business by 20%. Moreover, they also made further progress on their +$750M cost savings program.
Prior to the earnings release, shares were on the decline from their highs earlier in the month. While there was a bounce following the release, PRU has not been immune from the broader selling pressures.
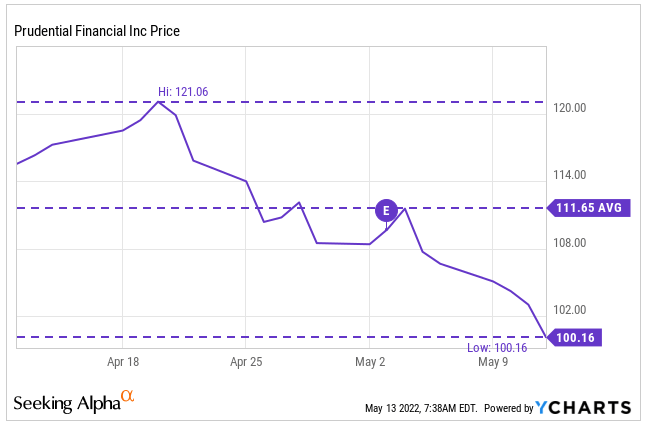
YCharts – PRU Price History
Currently, shares are trading at levels last seen in April of 2021 and at a sizeable discount to analyst price targets.
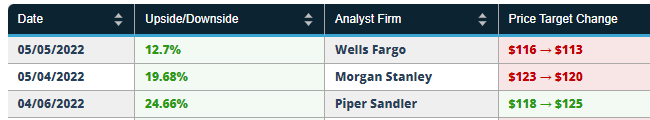
Benzinga – PRU Analyst Price Targets
For income-focused investors, PRU’s yield is now about 4.8%, which is generally in-line with the last several years but much higher than the levels seen in the years prior to 2018.
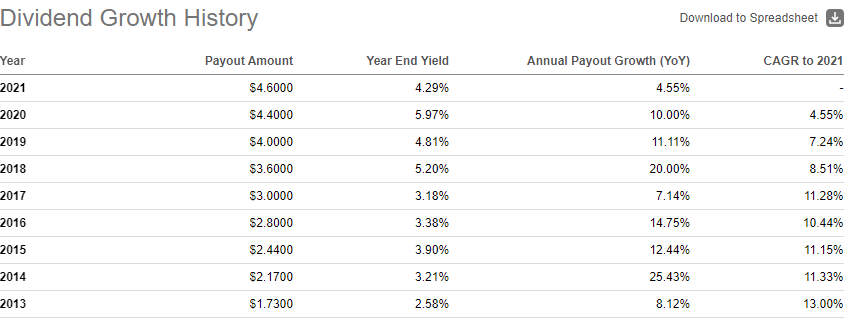
Seeking Alpha – PRU Dividend Growth History
PRU has a resilient business model and is successfully executing on their plans to reposition their business. In addition, they appear to be on track to achieve their cost-savings goals, and these savings should complement the strength in their balance sheet to facilitate further shareholder rewards in future periods. At its lows, PRU is another name worth further consideration.
Conclusion
On this week’s laggard list are two insurance companies and one utility. All three are trading at their lows, despite the defensive nature of their business models. With the broader markets on a continued slide, one would expect that a defensive name would at the very least have narrower losses. This, however, is not the case. LNC, for example, is down over 20% YTD, while the S&P is down about 17% over the same period. This is despite the benefit the company is expected to receive from rising rates.
While GS and HD aren’t defensive in nature, both are leaders in their industry and have capable business models to outlast the volatility and emerge stronger upon the eventual rebound. With earnings pending, HD is one to pay closer attention to, especially given its history of posting stronger than expected results. A strong beat paired with favorable guidance is likely to send shares significantly higher.
While market sell-offs are discouraging, they do open attractive entry points for many investors. This week provided five such openings for the watchlist of any long-term focused portfolio.