
Oselote/iStock via Getty Images
Price Action Thesis
We present a follow-up on our previous November article on CRISPR Therapeutics AG (NASDAQ:CRSP) with a detailed price action analysis. However, before that, we would like to update our readers that another analyst previously covered CRSP. Therefore, if you would like a more detailed treatment of CRSP’s scientific work, please refer to our previous article.
In this article, we will focus on the significant price action structures for CRSP and why we think it’s an opportune time to cut exposure. We observed that CRSP’s bullish bias has reversed after its double top bull trap in June 2021. Accordingly, our previous Buy rating was too optimistic, as our previous analyst didn’t pay attention to market dynamics.
Moreover, the market formed another bull trap (significant rejection of buying momentum) two weeks before its Innovation Day. Notably, the bull trap has remained intact as the market rejected further buying momentum. Moreover, CRSP remains in a dominant bearish bias.
As the price action remains close to its near-term resistance ($75), we believe it proffers investors a fantastic opportunity to cut exposure. Also, even at its current levels, we believe the opportunity in CRSP remains highly speculative.
Therefore, using price action as our guidepost offers investors clarity in their valuation models and helps them make sense of it.
Accordingly, we revise our rating on CRSP from Buy to Sell and urge investors to cut exposure. Our near-term price target (PT) of $46 implies a potential downside of 30% from June 24’s close.
CRSP – Double Top Bull Trap Doomed Its Bullish Bias
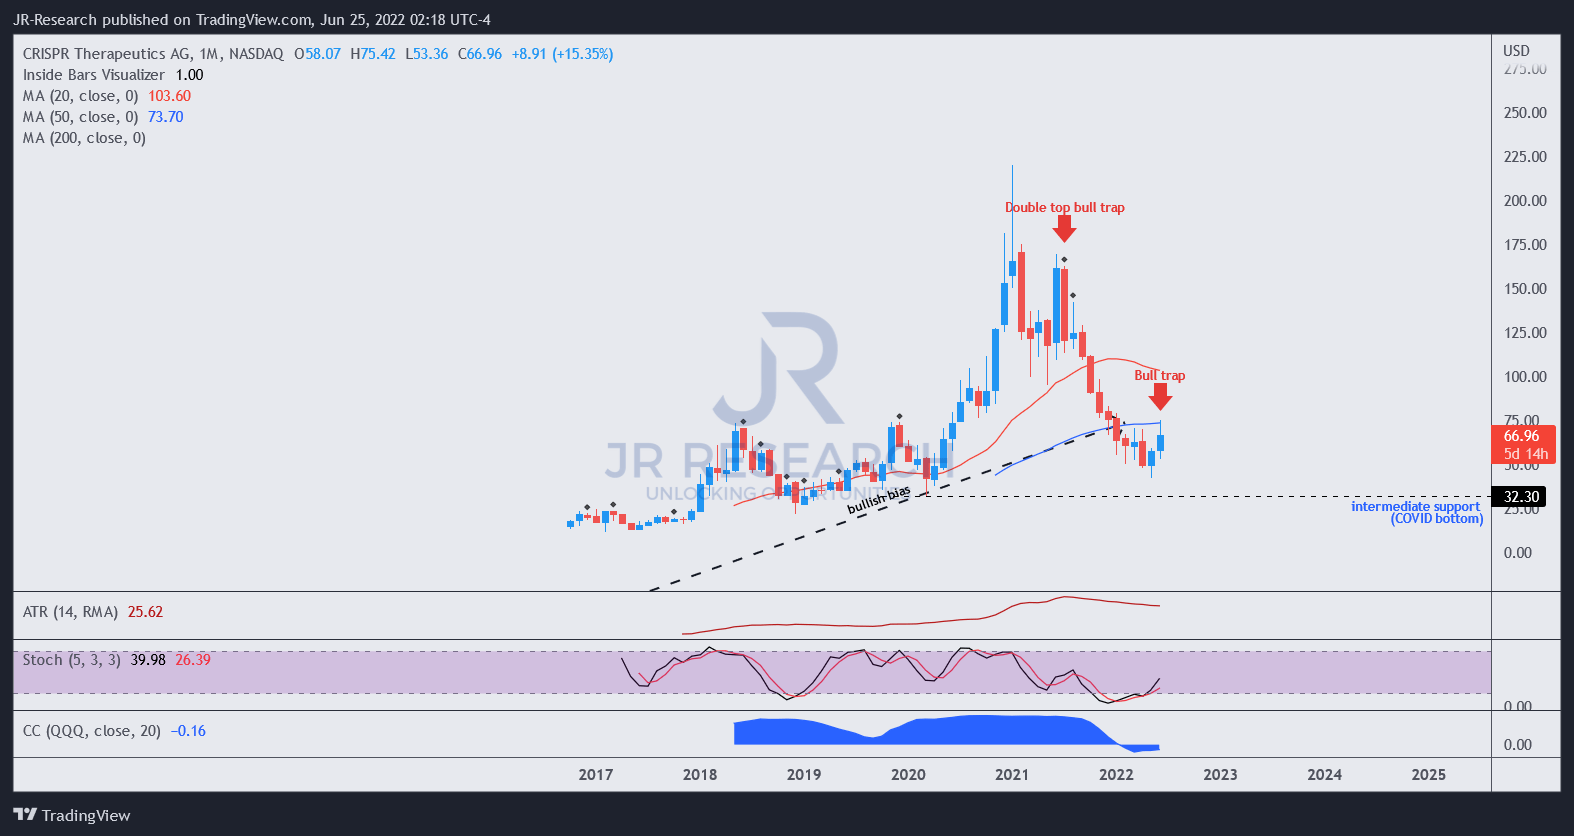
CRSP price chart (monthly) (TradingView)
CRSP formed a menacing double top bull trap in June/July 2021 that ended its bullish bias. Given the surge from its COVID bottom fueled by the Fed’s liquidity bubble, CRSP stock surged to unsustainable highs.
Therefore, the bull trap was apt and offered investors a prescient early warning sign (but, missed by our previous analyst), helping astute investors to lock in their gains earlier. JPMorgan (JPM) Asset Management CEO George Gatch made an astute observation recently of such price action, which he termed a “mountain face.” He articulated (edited):
“Speed is safety”… a mountaineering adage that I have come to live by. The longer you are on a mountain face, the more likely you will find trouble. But, if you have a bias toward speed— toward action—you reduce your exposure and increase the chances of getting down the mountain safely. I’ve seen this hold true personally and professionally. I always tell my team that I’ll gladly pay for your speeding ticket, but I won’t pay for your parking ticket. Maintain long-term focus, but be agile in the face of new challenges and opportunities. (George Gatch LinkedIn)
Therefore, recognizing a “mountain face” is of immense value for investors, which can be seen clearly in CRSP’s double top bull trap price action.
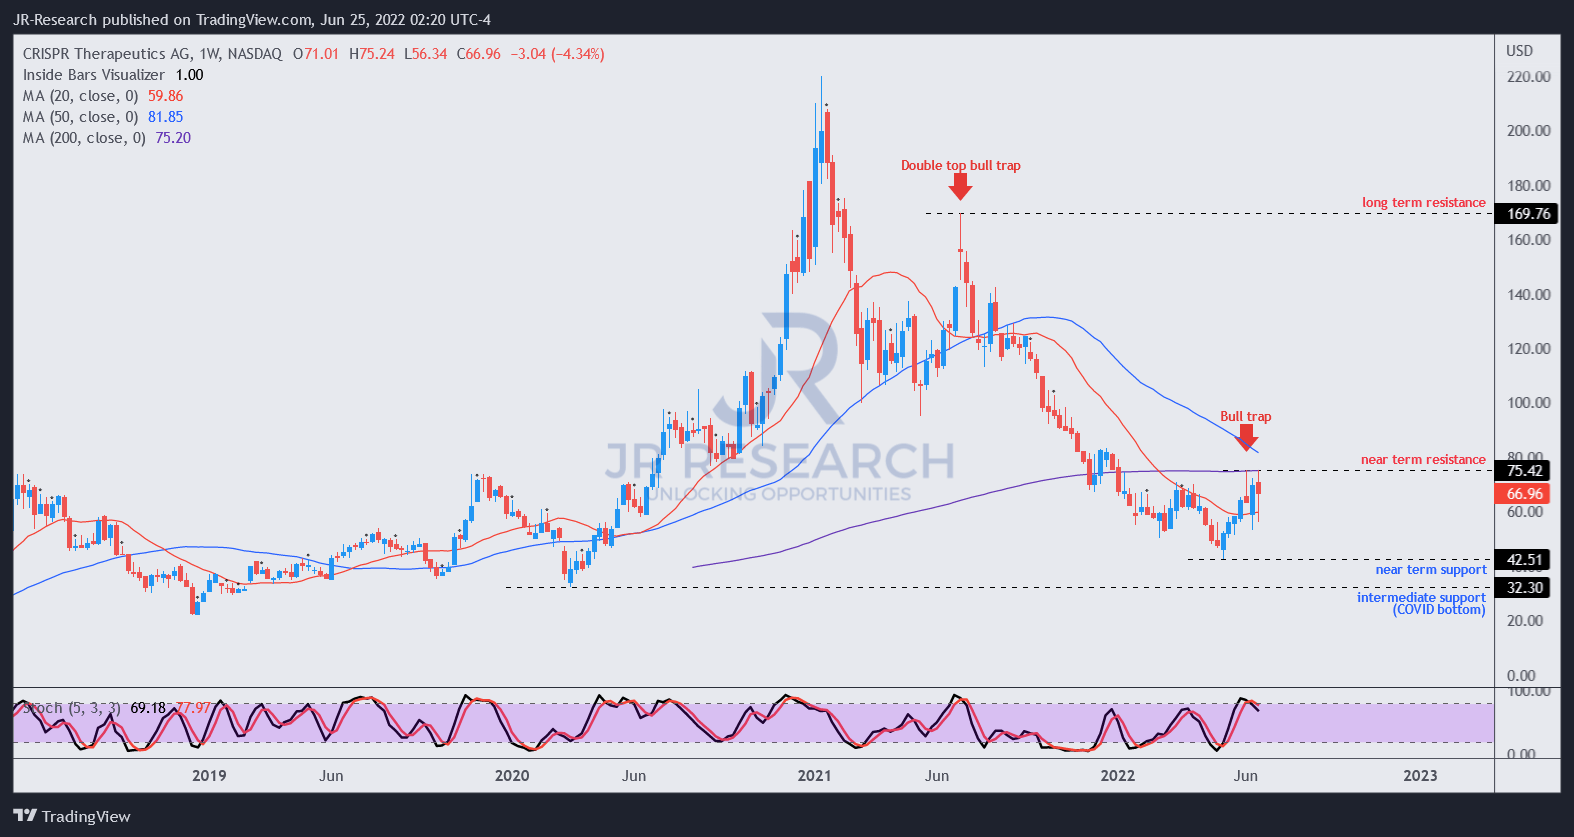
CRSP price chart (weekly) (TradingView)
We can more clearly corral CRSP’s double top bull trap in the weekly chart. Notably, it broke its bullish momentum since 2019 and sent CRSP tumbling into a decisive bearish bias.
However, it formed a near-term bottom in May (but no validated bear trap), which helped stage a near-term bounce. But, the bounce was resolved by another bull trap in June, two weeks before its Innovation Day. Therefore, we believe the market had astutely drawn dip buyers into June’s trap.
As such, we believe CRSP’s bearish momentum remains intact. Therefore, it offers investors an excellent opportunity to sell/cut exposure through its recent rally from its May near-term bottom.
Given its negative flow, we expect a re-test of its near-term support ($42.5). If a double bottom bear trap does not form subsequently, a further fall toward its intermediate support of $32.3 is likely in the cards.
It’s Hard To Value CRSP Stock With Confidence
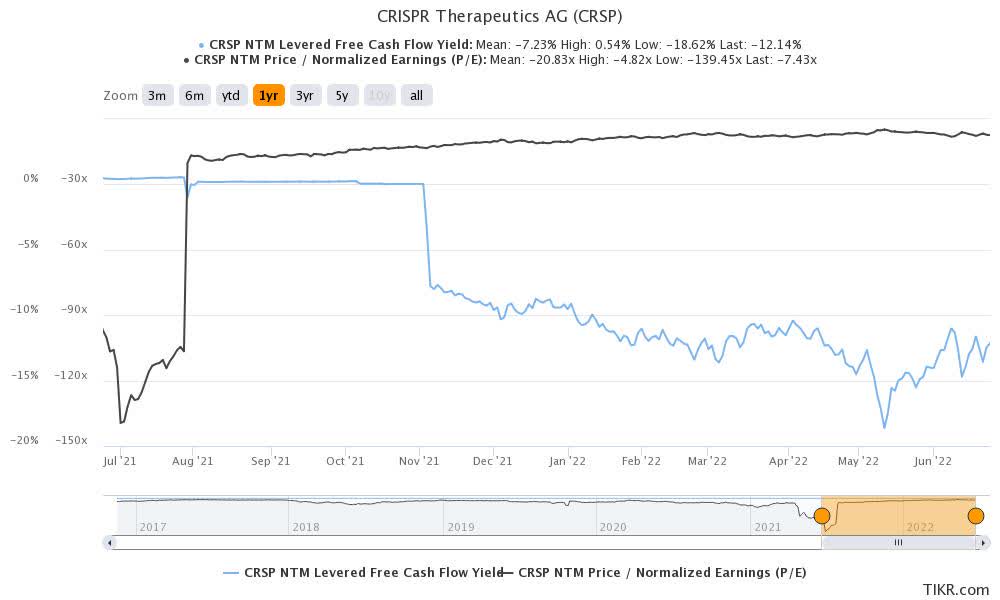
CRSP valuation metrics (TIKR)
For a clinical-stage company like CRISPR, applying fundamental valuation metrics is challenging, as seen by its negative FCF yields and normalized P/E.
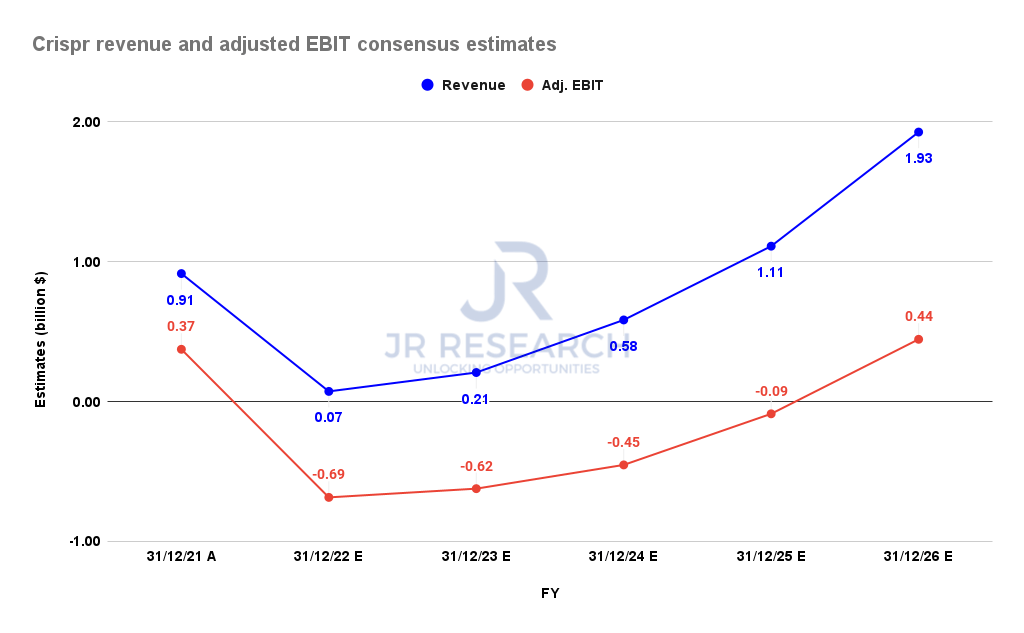
Crispr revenue and adjusted EBIT consensus estimates (S&P Cap IQ)
Notwithstanding, the Street’s consensus estimates (generally bullish) suggest the analysts are confident that CRISPR could deliver revenue of $1.93B in FY26, indicating a revenue CAGR of 124.6% from FY22-26.
However, CRISPR is expected to report adjusted EBIT losses through FY25. Therefore, we believe investors should consider any opportunity in CRSP as highly speculative.
| Stock | CRSP |
| Current market cap | $5.19B |
| Hurdle rate (CAGR) | 30% |
| Projection through | CQ4’26 |
| Required FCF yield in CQ4’26 | 2% |
| Assumed TTM FCF margin in CQ4’26 | 0.70% |
| Implied TTM revenue by CQ4’26 | $48.26B |
CRSP reverse cash flow valuation model. Data source: S&P Cap IQ, author
Furthermore, our reverse cash flow model suggests that CRSP stock is still overvalued at the current levels. Investors should note that the market has de-rated highly speculative stocks like CRSP due to their weak fundamentals.
However, if the price is right, and if they can generate sustainable long-term free cash flow (FCF) profitability, the market could still re-rate them.
But, even the generally bullish Street analysts expect CRISPR to post an FCF margin of just 0.7% in FY26, hardly something to cheer about. Therefore, the quality of CRISPR’s “massive” revenue CAGR is questionable.
Accordingly, we believe there’s little doubt that CRSP is still overvalued at the current levels.
Is CRSP Stock A Buy, Sell, Or Hold?
We revise our rating on CRSP stock from Buy to Sell. Our near-term PT of $46 implies a potential downside of 30% from June 24’s close. We urge investors to use June’s bull trap to cut exposure, as its price action is still close to its near-term resistance.
CRSP remains in a dominant bearish bias. We have also not observed a double bottom bear trap that could indicate a sustained bottom. Therefore, we urge investors to watch for a re-test of its near-term and intermediate bottom, moving ahead.
Our reverse cash flow model indicates that CRSP is still overvalued.