
nantonov/iStock via Getty Images
Wow, that recession got priced in fast, didn’t it!
My portfolio positioning has been cautious, but indexes are down ~15% from the end of last quarter, even with a strong finish last week. While I’m still bearish, I’m less so than at the beginning of the year.
The Energy Select Sector SPDR Fund (XLE) is down 22% from highs set in early June, despite what I believe is increasing evidence that energy supply is going to remain tight for an extended period, especially since it looks like most Russian export barrels are still making it to market.
We know that energy demand is inelastic, but how inelastic and over what time frames is a matter of debate. So in understanding recession risk on crude oil demand, I think back to the GFC and what happened to oil then.
My views on crude pricing – a lesson from the Global Financial Crisis
As I discussed in my first article on Cenovus (NYSE:CVE), an investment here is first and foremost a bet on continued strength in crude pricing. With the current talk about a recession, I think back to the worst recession in my lifetime, the global financial crisis. We lost 8 million jobs in 18 months and there was a clear environment of fear.
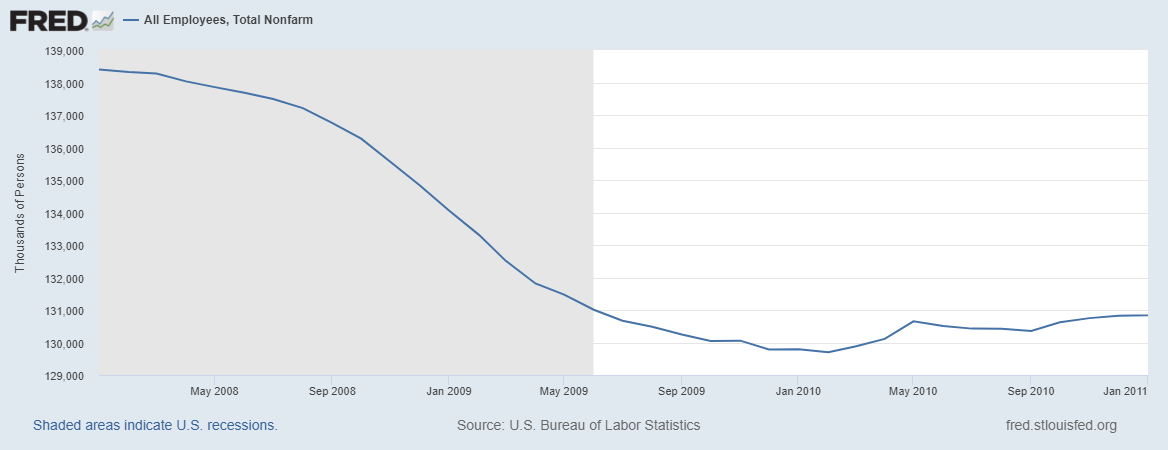
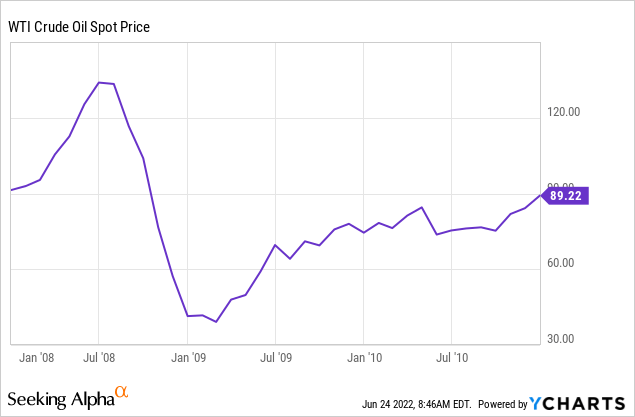
FRED
Even in the awful environment back then, crude didn’t stay down long. It traded back to $70 by July 2009 and then to $89 by the end 2011. Note that we’ve had 30% inflation since 2011, so $89 then is equivalent to $115 now.
This all happened before employment had come close to recovering while the housing market was hitting bottom. Crude supply was tight before the shale boom, and this kept prices higher, even with a weak broader economy.
I think we’re in a similar situation now. Supply is increasing, but very slowly, and EIA is predicting demand to grow again next year.
Governments around the world aren’t helping the situation. The lack of realistic and coherent energy policies, coupled with the vilification of the energy industry with additional windfall taxes (the UK windfall tax, recent increased coal royalties in New South Wales, Australia) is going to keep a lid on supply increases and new large scale investments.
I firmly believe high energy prices are here to stay for a long time.
Elevated Crack Spreads a major tailwind for Cenovus
The Husky acquisition looks better by the day, because it added significant refining capability for Cenovus. The current lack of refining capacity is as much to blame for the higher pump prices as the price of oil itself.
Cenovus May Investor Presentation
The difference between the price of crude, and the price of end products like gasoline and jet fuel is measured by a crack spread. In the 2021 Investor Day Presentation, Cenovus forecast a 3-2-1 crack spread of $18, with a sensitivity of +$180 million for each additional dollar in margin.
The 3-2-1 crack spread has averaged over $50 this month and is around $60 today.
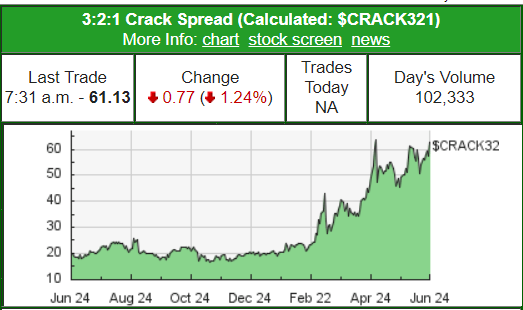
3-2-1 Crack Spread computed by EnergyStockChannel
The US has lost a significant amount of refining capacity in recent years, and now that product demand has returned in force, we’re seeing record crack spreads. While no one expects spreads to stay at these levels, I believe these could remain “higher for longer” than most expect.
“Calendar spreads” which measure implied future crack spreads, have widened recently. Even going out 12 months, refiners can lock in historically wide spreads for producing refined products.
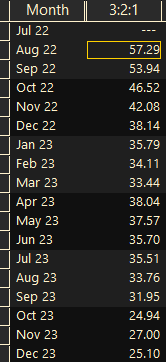
US 3:2:1 crack spreads as of 6-23-22
While the headline WTI or Brent crude prices attract media attention, crack spreads are equally important to an integrated producer like Cenovus. Right now, they are a massive tailwind.
Cenovus Earnings/Cash Flow for Q2 and Q3?
Cenovus has clearly articulated its capital return policy. A key question for most investors is “When do we hit the $4 billion mark.”

Cenovus May Investor Presentation
To figure this out, we need to ballpark earnings and cash flow for the next several quarters.
Here is what Q1 looked like (note: these figures are in Canadian dollars.)
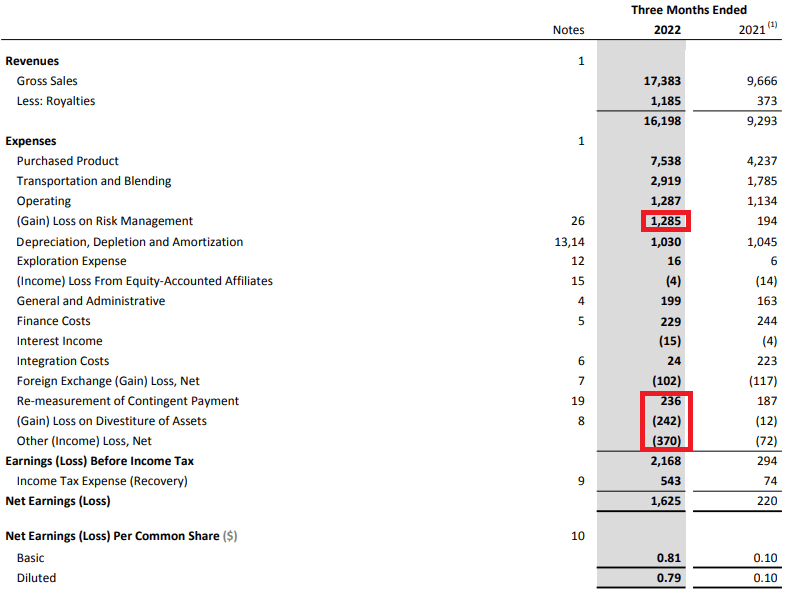
Cenovus Q1 Earnings
To guesstimate Q2, we’ll start with Q1 numbers then make adjustments. Consider this napkin math and I’m going to use round down to be conservative.
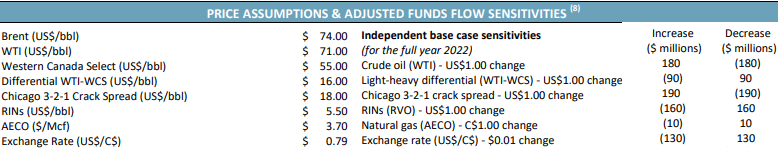
From Cenovus’s Q1 Summary, we had $94 WTI and $19 crack spreads.
For Q2, the average WTI price is $105 and crack spreads are around $50. For Q3, I’ll also use WTI price of $105 and crack spread of $55, about where futures are pricing these right now.
I’ll start with Q2’s pretax earnings of $2168 million. Using the latest sensitivities in the May Cenovus Investor Presentation
- WTI Pricing of +$11/bbl over the base case assumption of $94/bbl. $95 million multiplied by $11/bbl, divided by 3 (for the one quarter) = +$350 million.
- Crack Spreads of $50, up +$31 over realized Q1 prices. Guidance of +$105 million per $1 change, +$1085 million. I’m going to subtract $300 million from this total as there is significant refinery maintenance in Q2. So we’ll use $785 million.
- I’ll add back $742 million for the smaller hedging loss in Q2 (I re-grossed this number up as Cenovus reported after-tax impact in their announcement.)
- I’ll add back another $100 million for the Contingent Payment, as this only applied up until May 17th. It goes away entirely in Q3!
- Subtract the gains of $242 million for divestiture of assets and $370 million of other Income (most of this is insurance proceeds from the Superior Refinery) as these are non-recurring.
In total, I see Q2 pretax earnings of $3.5 billion, and Net Earnings of $2.6 billion.
Q3 gets even better. The contingent payment is gone, so we can add back $136 million. There’s no hedging loss, so we add another $543 million. Refining maintenance season is wrapping up and crack spreads are a little higher, so we add another ~$500 million.
Q3 pretax earnings could be closer to $4.7 billion, and Net Earnings of $3.5 billion, or $1.70/share.
Note that I’m using earnings for this exercise, so free cash flow will be somewhat higher as some of their expenses are non-cash, and because D&A is running slightly above CapEx.
Conclusion
I think it is possible for Cenovus to do $6 billion or more in free cash flow combined between Q2 and Q3. That’s enough cash to hit their net debt target of $4 billion and have another $1.6 billion left over for repurchases and dividends. I hope they wait until Q4 to hit the debt target, and instead ramp up repurchases now. Cenovus did not repurchase any shares in May, presumably to fund the Sunrise acquisition (which I think was an absolute steal) while continuing to pay down debt.
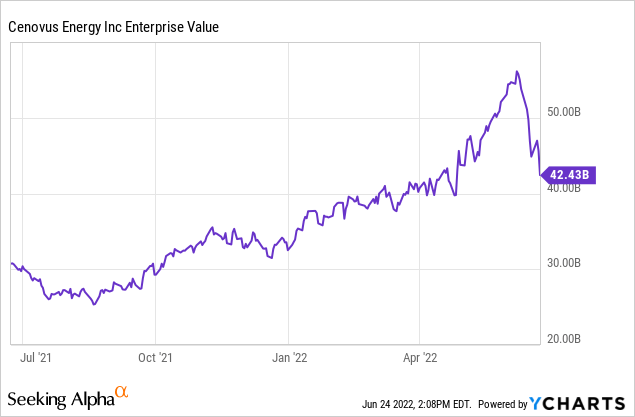
If the shares don’t move higher (which I find unlikely) the cash flow over Q2 and Q3 will reduce enterprise value back to levels from last Fall, when oil was under $80 and crack spreads were around $17.
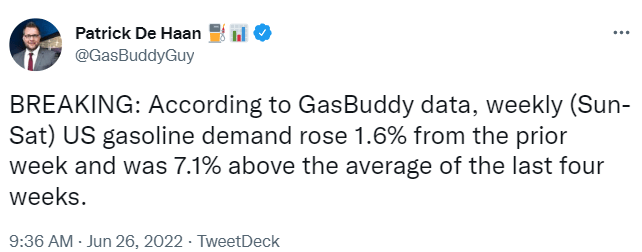
GasBuddy
Despite all the talk of recession and canceled trips due to high prices, domestic demand does not seem to be slowing. Gasoline demand is still increasing despite pump prices effectively pricing in closer to $140+/barrel oil ($105 oil + $60 crack spreads, where $20-25 crack spreads are more the norm.) June 25th recorded the highest number of travelers since early 2020 and this weekend even more are expected.
For one final exercise, let’s get bearish and look ahead to 2023. Let’s assume the oil price and crack spreads revert to levels from earlier this year when Omicron was still depressing travel, but also consider the 2023 list of incremental positives for Cenovus
- Superior refinery restart (+50kbpd refining capacity.)
- Terra Nova coming back online (+10kbpd per day production.)
- Increased stake in Sunrise (+25kbpd per day production.)
- Absence of a contingent payment to ConocoPhillips (COP).
- Lower net interest expense, dropping from ~$125 million/quarter in Q1-22 to ~$60 million/quarter.
- End of integration expenses from the Husky acquisition ($100-150 million for 2022.)
Even in a lower price environment, Cenovus should still be producing $2-2.5 billion in free cash flow a quarter. At the current share price, that would allow them to repurchase 10% of the outstanding shares and pay a 10% dividend, and still have money left over. Now imagine if the current price environment sticks around, or what happens when the global SPR releases wind down.
As I said – Buy the dip.