Tomas Ragina/iStock via Getty Images
Thesis Overview
The Ukraine-Russian war broke out on Feb 24, and it has been ongoing for more than 200 days (207 days to be exact as of this writing). Since the war broke out, both crude oil and natural gas prices have not only increased substantially but also gyrated widely and therefore creating immense uncertainties for energy investors. Sadly, according to Lindy’s Law, the longer a war has dragged on, the larger its chance of dragging on longer. After going on for 200 days, the war’s chance of going on for another 200 days actually INCREASED, not decreased. And therefore, I anticipate such large gyrations to continue, and energy investors should be prepared by understanding how different energy stocks respond to large natural gas and oil price oscillations.
The war significantly disrupted the global energy supply as Russian crude oil represents about 6% of the total global market before the war. Particularly in Europe, it provides nearly 40% of the EU’s natural gas needs and more than 25% of its oil needs. To wit, the supply-demand imbalance has caused oil prices to rocket from $52.2 per barrel at the beginning of the year to a peak level of $130.5 in March shortly after the war broke out (see top panel below), exceeding the $130 mark for the first time since 2008. Then it fell to about $85.3 as of this writing, a whopping 35% decline off the peak. Natural gas prices have fluctuated even more. it surged from $2.7 at the beginning of the year to a peak level of $9.68 in August (see bottom panel below), again, the highest price unseen since 2008. Then it fell to about $7.87 as of this writing, a 19% decline off the peak. Despite the sizable drop, natural gas prices are still up 191% YTD.

Source: Author based on Yahoo data
Against this backdrop, this article analyzes several major energy stocks. Readers familiar with our writing know that we are in general bullish about the whole energy sector under current conditions. And we have written extensively on many of them individually.
In this article, we will take a different approach and provide a more comprehensive overview of the entire energy sector. We will examine the impacts of oil and natural gas prices on several major energy stocks, and also assess their role of them as a hedge against geopolitical risks. So that investors can make an informed decision tailored to individual risk profiles and needs.
As such, this article is a bit longer (actually A LOT longer) than our usual articles that focus only on 1 or 2 stocks. Thus, here let me provide an outline to help you navigate this article in case you want to skip certain parts. The remainder of the article consists of four main sections.
- In the first section, I will provide my thoughts on integrated players with an emphasis on production. And my main thesis here is that these stocks are the ones best poised to weather large energy price fluctuations, and also the ones best poised to benefit should oil and natural gas prices further rise. And I will use Exxon Mobil (NYSE:XOM) as the example to illustrate my thesis, but the thesis is valid for other major integrated players as well, such as Chevron (CVX), Shell (SHEL), BP (BP), Suncor (SU), et al.
- In the second section, I will provide my thoughts on pipeline players. And my main thesis here is that these stocks are the ones that are best insulated from the turbulence created by the Russian/Ukraine situation and other global geopolitical risks as well. Therefore, on the positive side, these stocks can enjoy stable earnings and keep paying dividends generously even in the case of a downward correction in oil and natural gas prices. However, on the negative side, these stocks would not enjoy too much price appreciation in the case of an upward oil and natural gas price rally either. And I will use Enbridge Inc. (NYSE:ENB) as the example to illustrate my thesis, but the thesis is valid for other major pipe players as well, such as Energy Transfer LP (ET) and Enterprise Products Partners (EPD),
- The third section will discuss refineries, such as Phillips 66 (PSX) and Valero Energy Corporation (VLO). My main thesis is that they face a mixed situation here, and I have a neutral view of them. Rising oil and NG prices will lead to increased costs on their feedstock. While on the other hand, currently, gasoline and diesel prices are near a peak level in years too, which leads to higher profits. Their valuations are relatively expensive at current levels. Finally, high diesel and gas prices usually get transformed into a political issue.
- Lastly, the fourth section will discuss service players, such as Schlumberger Limited (SLB) and Halliburton Company (HAL). The main thesis is that they are essentially a leveraged play on the energy sectors, providing higher risk and higher reward potential at the same time. They are appealing to more risk-prone investors for several reasons. They are relatively undervalued now. They will benefit from the even higher-order effects and hence benefit more sensitively if energy prices rise. They do not directly benefit from rising oil or NG prices or suffer from them. However, they will benefit more sensitively when the producers (such as XOM and CVX) expand on their CAPEX spending, which is very likely to happen given the cash earned by producers and the energy shortage created by the Ukraine/Russian situation.
1. Integrated Producers – XOM in focus
As aforementioned, my view is that leading integrated players such as Exxon Mobil (XOM) are best poised to weather the uncertainties ahead and benefit if energy prices further rise. The same analysis and conclusion are applicable to other major integrated players such as CVX, SHEL, BP, and SU. And here I will just focus on XOM for the sake of brevity.
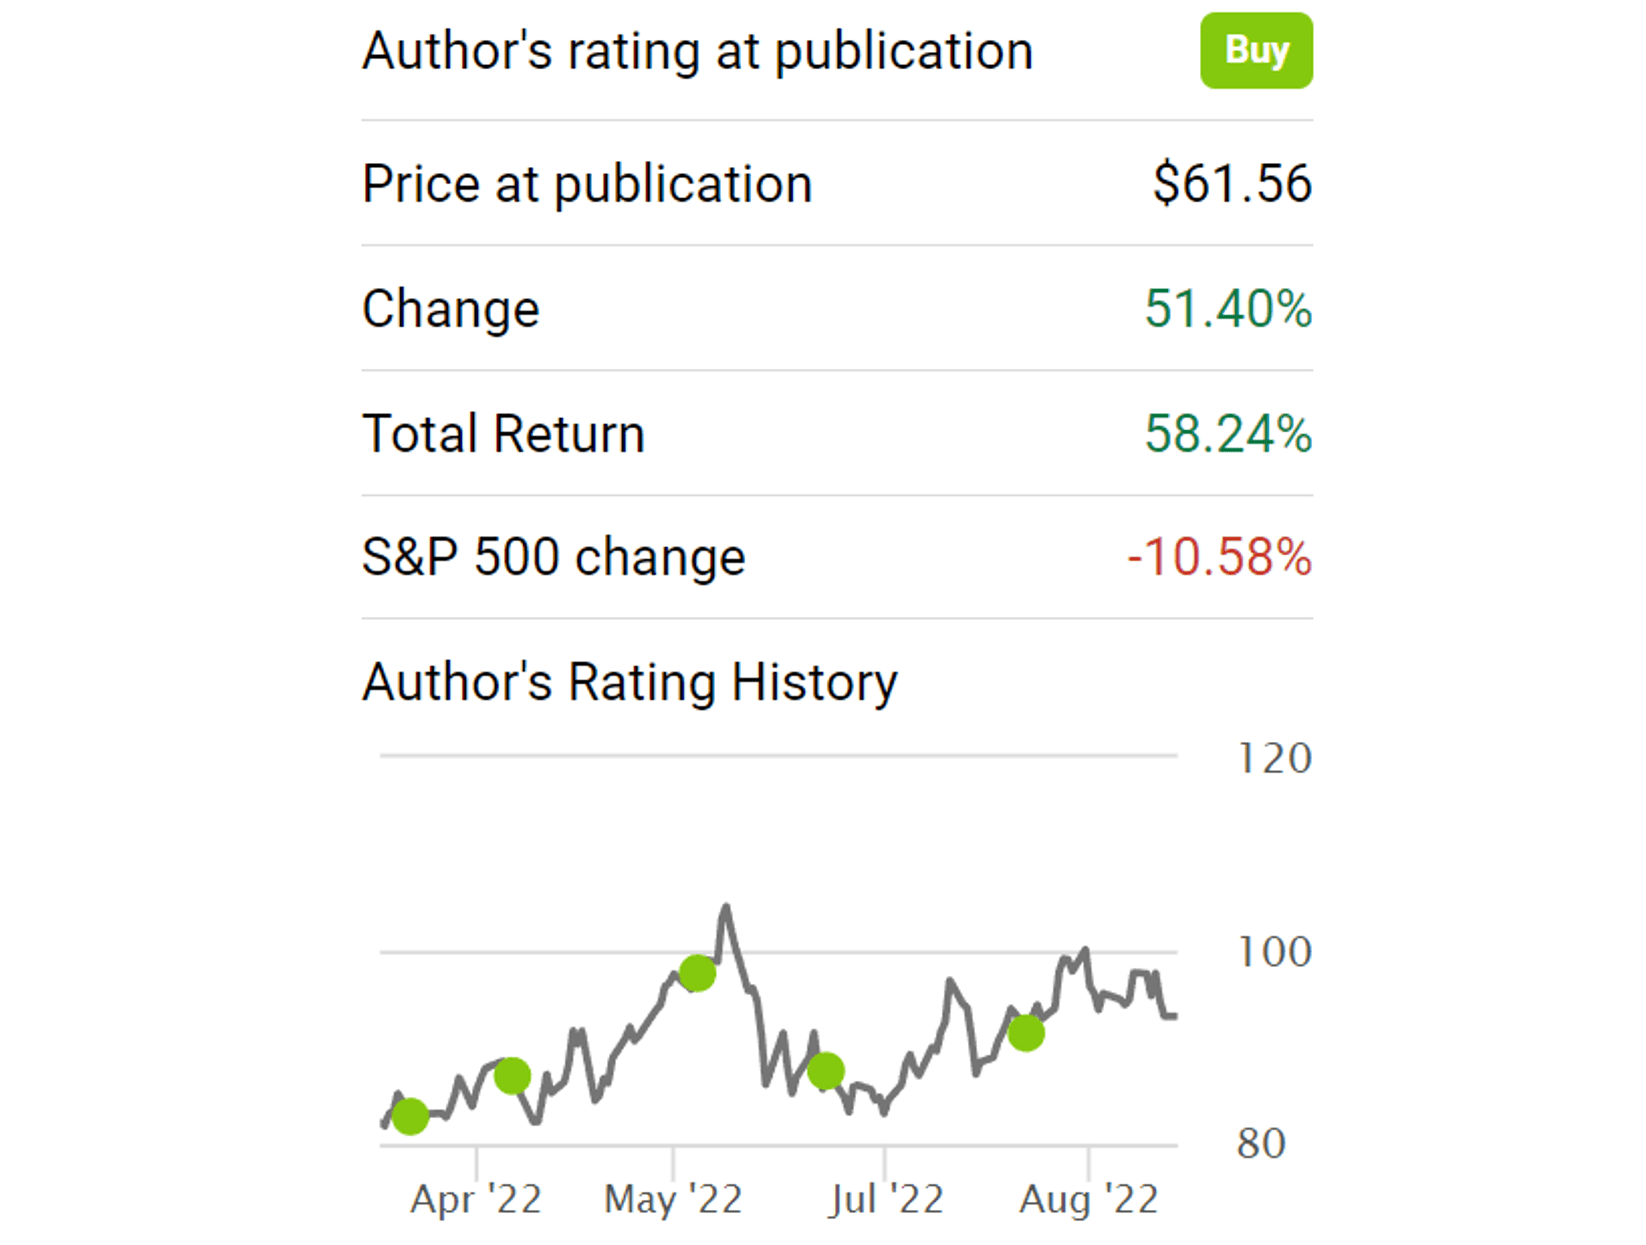
I have been bullish on XOM before the Russian/Ukraine war broke war. For example, my article published in Oct 2021 argue that XOM is a “Key Piece of The Risk Puzzle” under the market conditions at that time. The main arguments in that article are summarized below. The overall market was at an extremely expensive valuation back then. And XOM has delivered a total return of 58% compared to a loss of 10% suffered by the overall market. And I see these reasons are still valid today (probably even more so given the likelihood of the Russian/Ukraine war lasting another 200 days):
- XOM is an investment that is not only shielded from the major market risks (inflation, interest rate, and extreme market valuation) but also helps investors to fight against these risks.
- As oil prices stay well above Exxon’s breakeven price (about $45 per barrel based on my analysis), XOM will generate plenty of free cash.
- And there are good reasons for oil prices to keep staying well above Exxon’s breakeven prices. Oil prices have been consistently beaten inflation in the past until it stopped in the past 10 years. Crude oil price, before the surge caused the Ukraine/Russian conflict, was about $90 – the same as about 10 years ago. As a result, a rally in oil prices is overdue even if just to compensate for inflation.
Source: Seeking Alpha data
Looking forward, I see the arguments laid out above are still valid. And moreover, I see a few additional catalysts on the near horizon now given the events that have transpired since the war broke out.
Oil and natural gas prices could rise from their current level substantially as winter approaches and also supply dwindles. As an example, in a recent interview with CNN, U.S. Treasury Secretary Janet Yellen said gasoline prices could surge again this winter as the European Union sharply reduces its purchases of Russian oil. European Union is expected to stop most of its purchases of Russian oil. It also imposed a ban on services that allow Russia to use oil tankers to transport crude oil. The G7 countries also reached an agreement to ban the provision of “services which enable maritime transportation of Russian-origin crude oil and petroleum products globally” above the price cap. As these measures are expected to be ready around December, international natural and oil prices are bound to fluctuate, and most likely upward in my view.
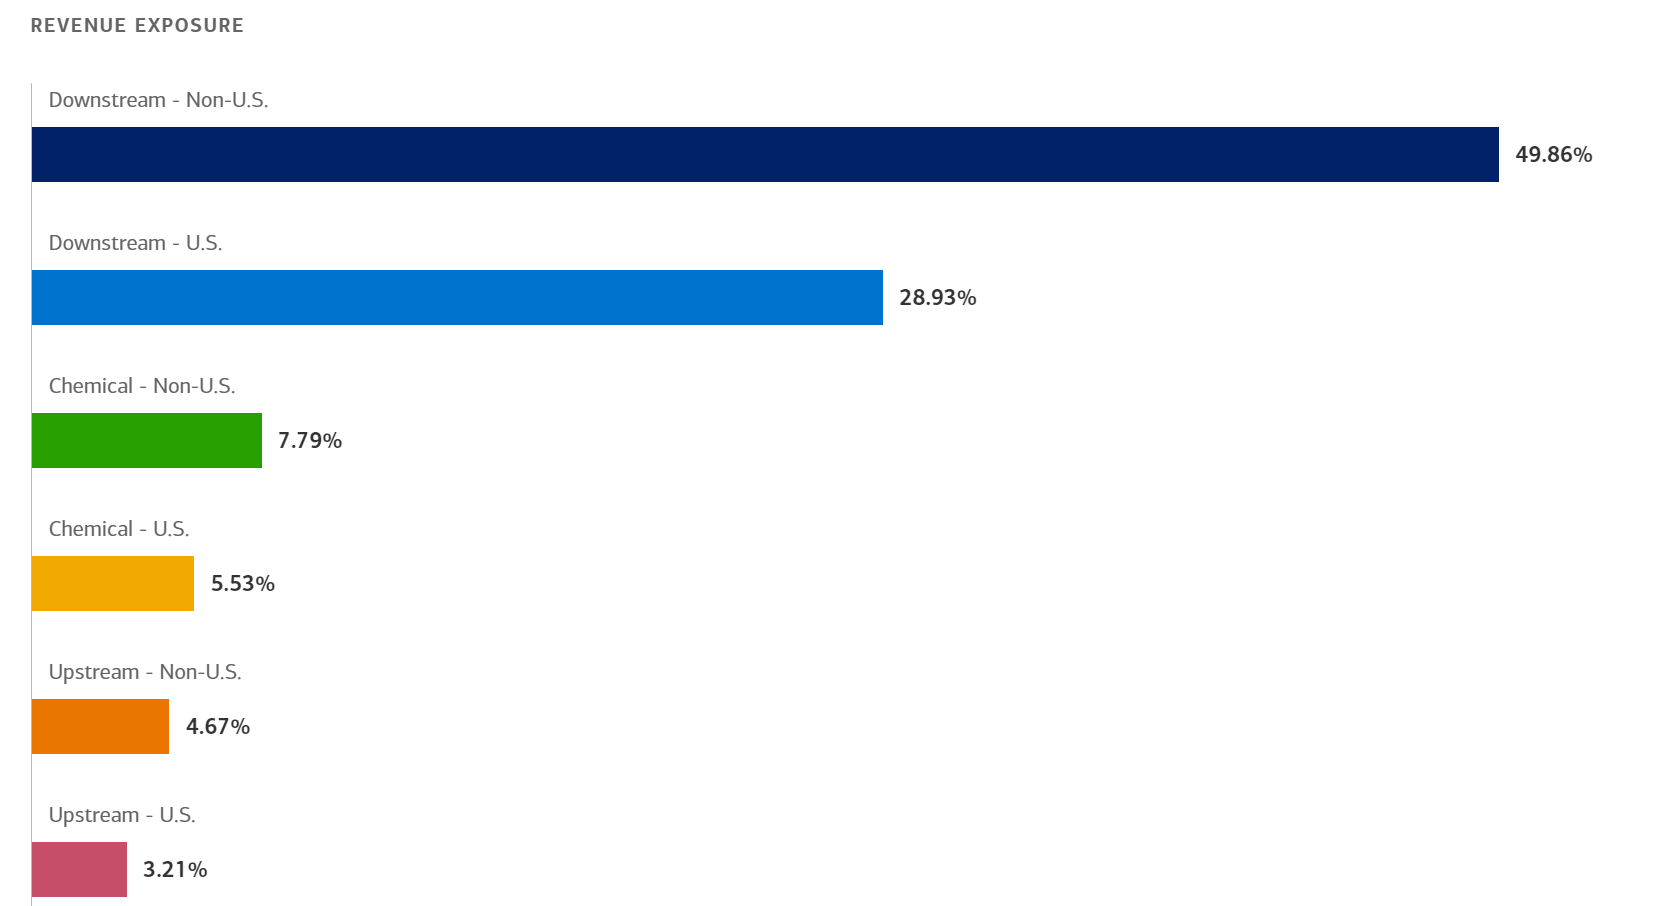
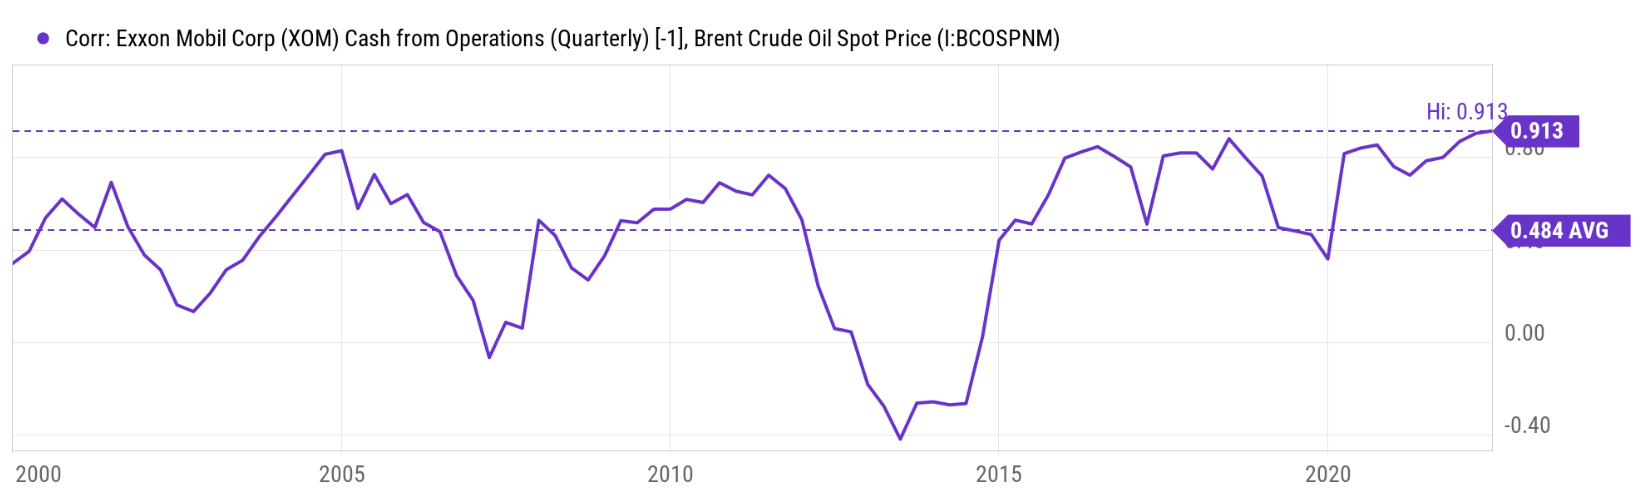
And XOM, as a major integrated player with an emphasis on production, is best poised to benefit if energy price does rise and best poised to weather the turbulent if it does not. As seen from the chart below, XOM features well-diversified streams for revenues encompassing upstream and downstream operations. It produces about 2.3 million barrels of oil per day in recent years and about 8.5 billion cubic feet of natural gas. As a result, its operating income is positively, actually strongly positively, correlated with both crude oil and also natural gas prices. As seen from the second chart below, the correlation coefficient with crude oil prices has been above 0 most of the time. The long-term average is a strong 0.484. And the peak correlation, which is what we are experiencing now, hovers around 0.91 (i.e., an almost perfect step lock correlation).
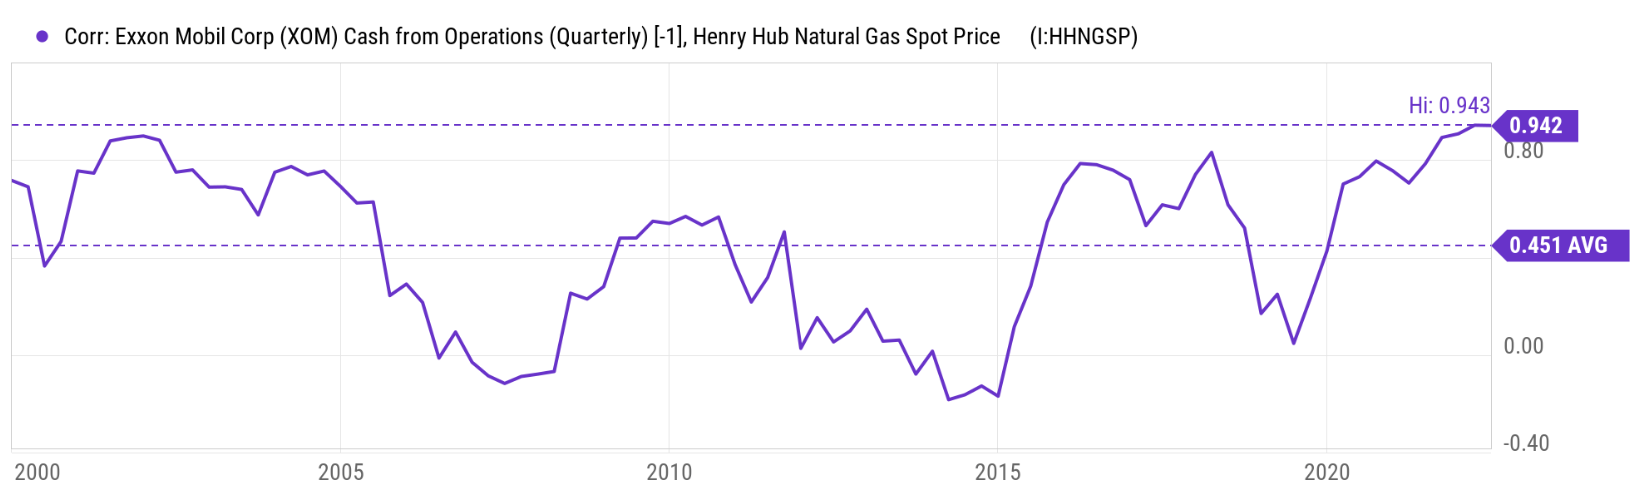
As seen from the third chart below, the correlation coefficient with natural gas prices has been equally strong (and currently even a bit stronger than oil prices). It has also been above 0 most of the time. The long-term average is a strong 0.451. And currently, correlation stands at 0.94, even stronger than the current correlation with oil prices.
Source: Merrill Edge data
Source: Seeking Alpha data
Source: Seeking Alpha data
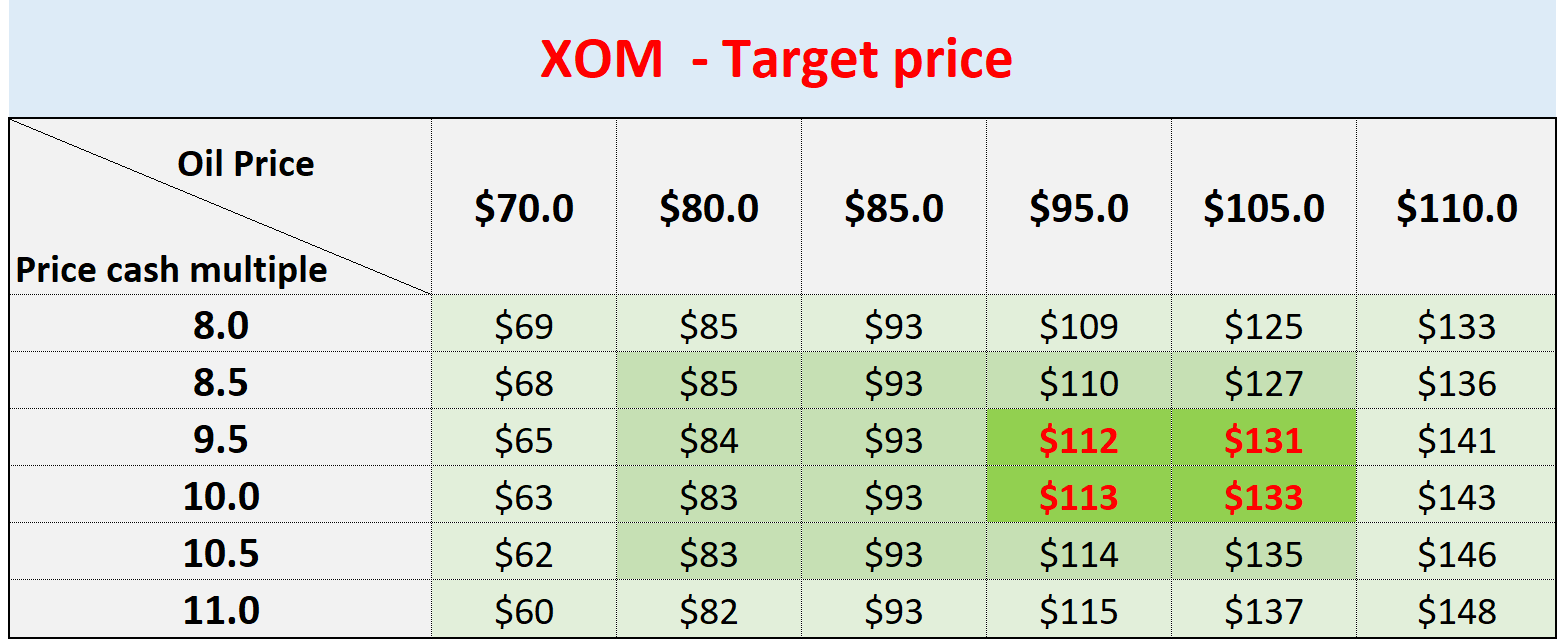
To put things under perspective, the NG sales are about 19.2% of the oil sales for XOM. Therefore, the revenue from NG is a considerable segment of its production, but oil still dominates. Therefore, in terms of projected returns, as shown in the next chart, I only considered the effects of oil price changes. The current oil price of around $85 a barrel is well above its breakeven point (assumed to be around $45 per barrel). Based on XOM’s current production, every $1 increase in oil price would contribute $2.3M of additional income per day for XOM at its current production rate. And on an annual basis, this translates into about $0.84B of additional income or $0.2 per share.
Therefore, with a combination of a $95 per barrel oil price and a valuation of 9.5x cash flow, a target price in the triple digits can be supported. And my view is that those numbers highlighted in red are the most likely scenario given the business fundamentals and catalysts in the near term.
Finally, before leaving this section, it is worth noting that the target price projected here would be on the conservative side in my mind for several reasons. As just mentioned, the projection considered the profits driven by oil price only. It ignored other profit drivers such as natural gas and its downstream segments.
Source: Author based on Seeking Alpha data
2. Pipeline stocks – ENB in focus
Now let’s move onto to pipelines. This section focuses on ENB. And again, the same analysis and conclusion are applicable to other major pipelines EPD and ET.
In contrast to the producers, whose operation income strongly and positively correlates with rising oil and natural gas prices, the pipelines have low or no correlation to oil and NG prices, as you can see from the two charts below. The pipeline segment is also called the midstream segment in the energy sector because they kind of serves as the middleman. Instead of producing or selling, they provide transportation and storage services for oil and natural gas products. They are like the railroad system to the energy enterprise, and hence their profit is insensitive to the prices of the goods they are transporting/storing.
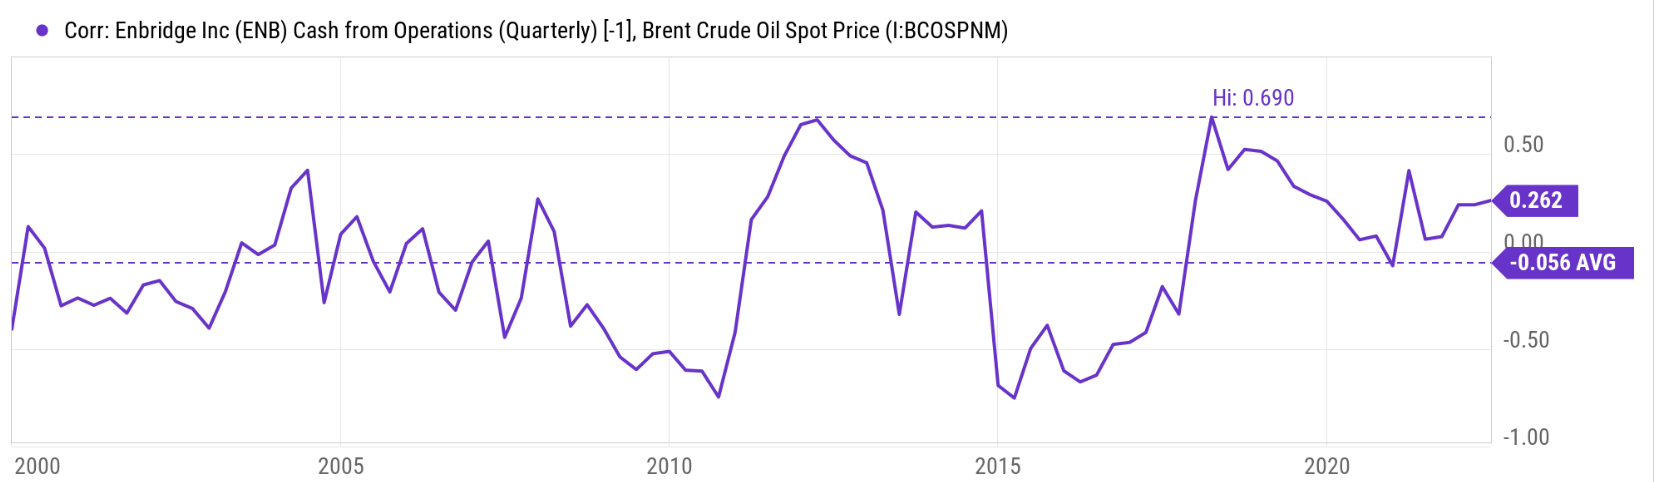
You can see such insensitivity clearly from the following two charts. These charts show the correlation between ENB’s operating cash flow versus oil/natural gas prices. And here you see a completely different picture compared to these we’ve seen with XOM above. To wit, its operating income shows little correlation with both crude oil and also natural gas prices. As seen from the first chart below, the correlation coefficient with crude oil prices has been essentially 0 on average in the long term (meaning no correlation at all). Do not be alarmed by the current positive correlation of 0.262, which is a very mild level of correlation, and also it’s totally within the range of random fluctuation.
As seen from the second chart below, the correlation coefficient with natural gas prices is equally weak with a long-term average of essentially zero also. And currently, the correlation stands at 0.088, also weak and squarely within the range of random fluctuations.
Source: Seeking Alpha data

Source: Seeking Alpha data
Under current conditions, pipeline stocks are good choices for more conservative investors, especially with a need for current income, for several reasons.
Firstly, their insensitivity to oil and natural gas prices as just mentioned. Furthermore, their assets and operation are located in North America and shielded from the Ukraine/Russian situation. ENB has some international operations. But its operation exposure is concentrated in Canada and North America in general. It operates the world’s longest crude oil and liquids pipeline system primarily located in Canada, and it owns and operates Canada’s largest natural gas distribution company. Its most important service areas are Ontario, Quebec, New Brunswick, and New York State.
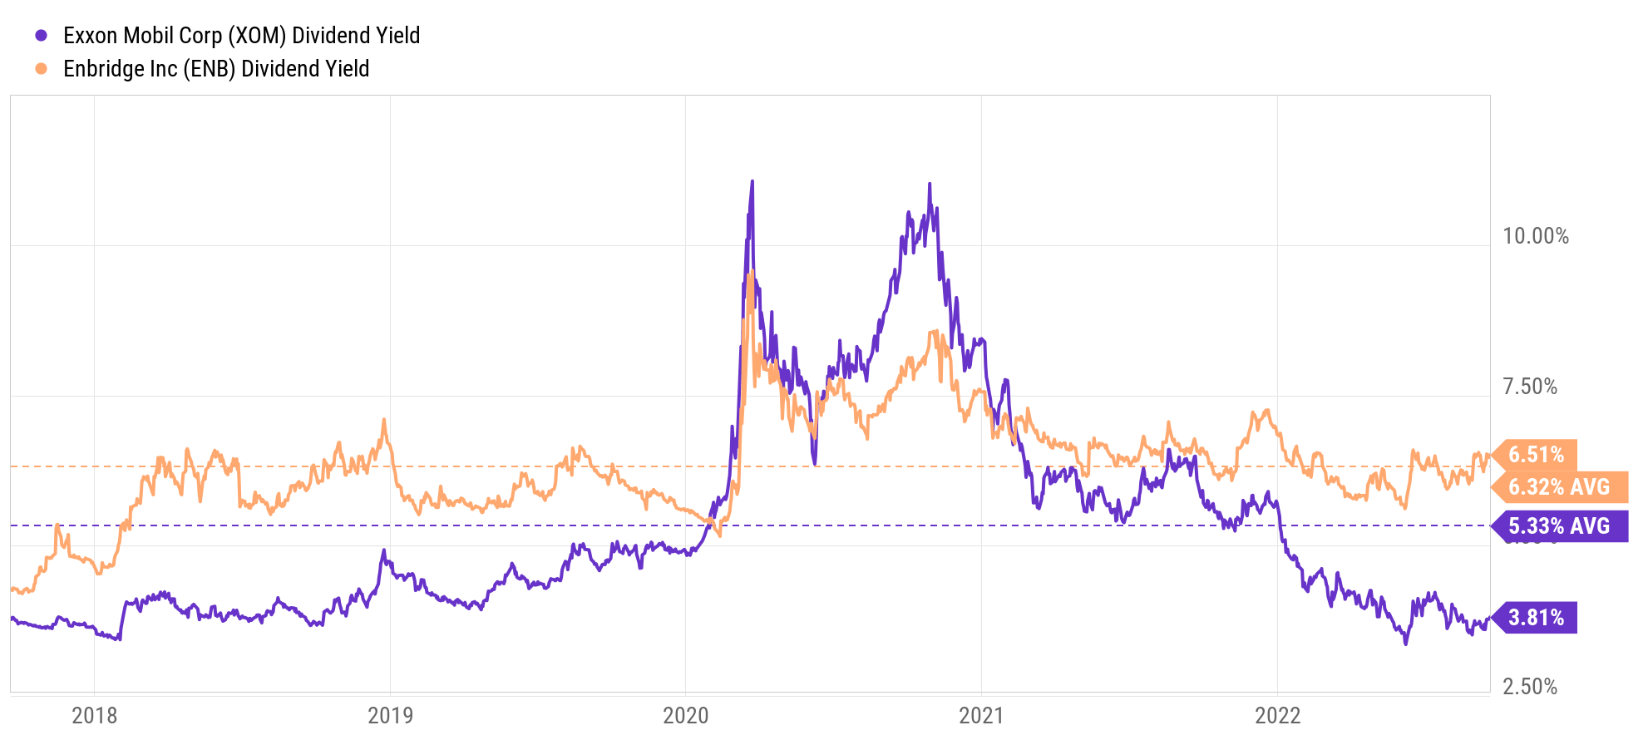
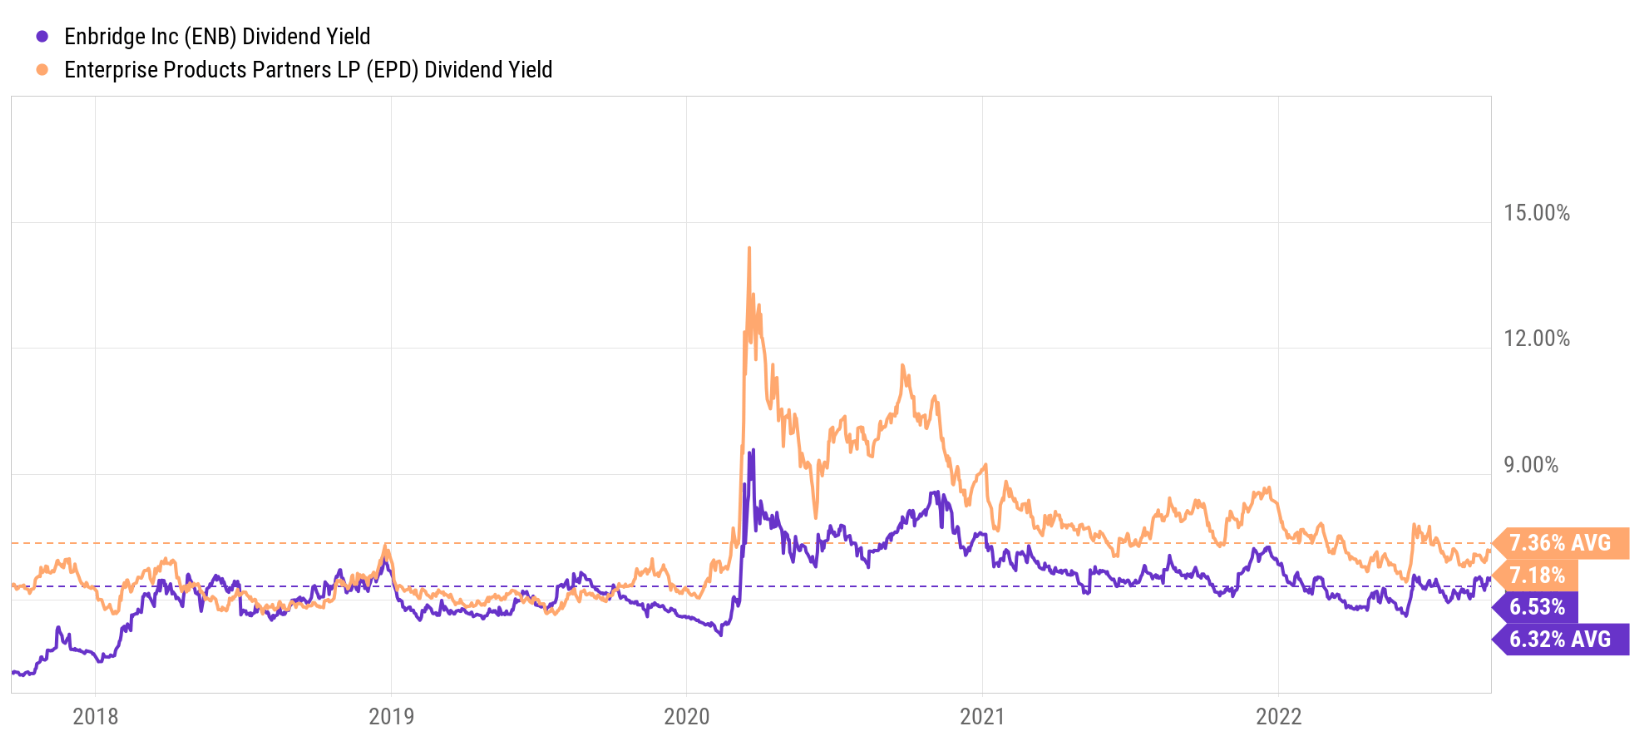
Secondly, their generous and safe dividend yield provides a further hedge for income-oriented and less risk-prone investors. Currently, the dividend for ENB is about 6.51%. To put things under historical perspective, the dividend yield for ENB has fluctuated in the past decade between 5.0% and 7.5% with an average of 6.32%. Therefore, its current dividend yield is quite attractive in absolute terms and also relative terms. For example, it is almost 2x higher than XOM’s 3.81% current yield and slightly above its historical average of 6.32%.
Source: Seeking Alpha data
Lastly, ENB (and together with other pipeline stocks) are currently valued reasonably (or even at a small discount) providing a margin of safety. As you can see from the following chart, in terms of dividend yields, ENB is yielding 6.53% currently. It is about 3% above its historical average of 6.32% (in relative terms), signaling a small 3% valuation discount. The picture for other pipelines such as EPD is similar. EPD is yielding 7.18% currently, almost exactly on par with its historical average of 7.36% (2.5% lower to be exact).
Source: Seeking Alpha data
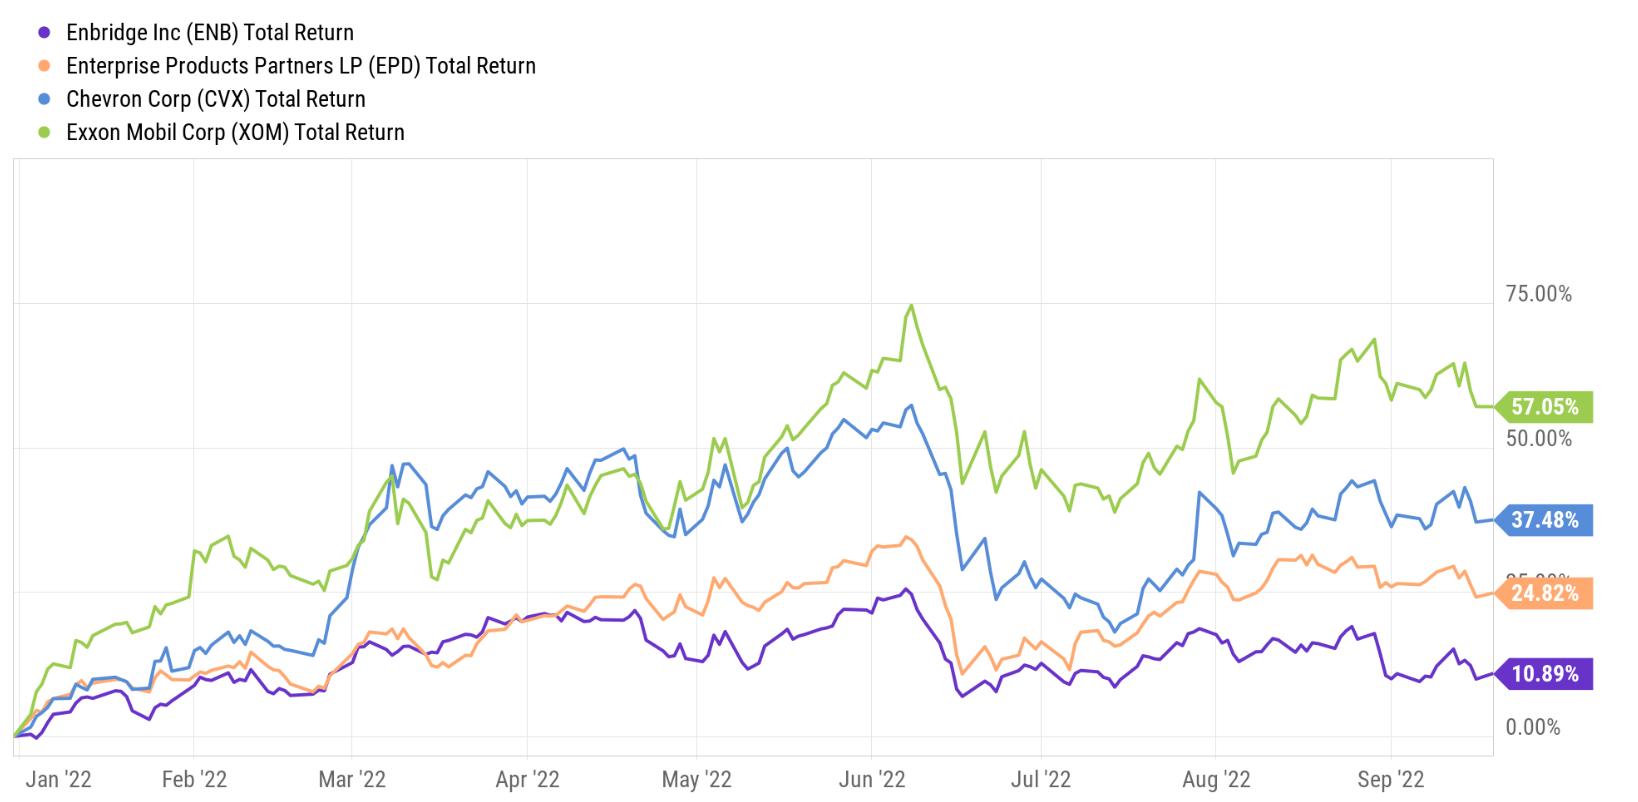
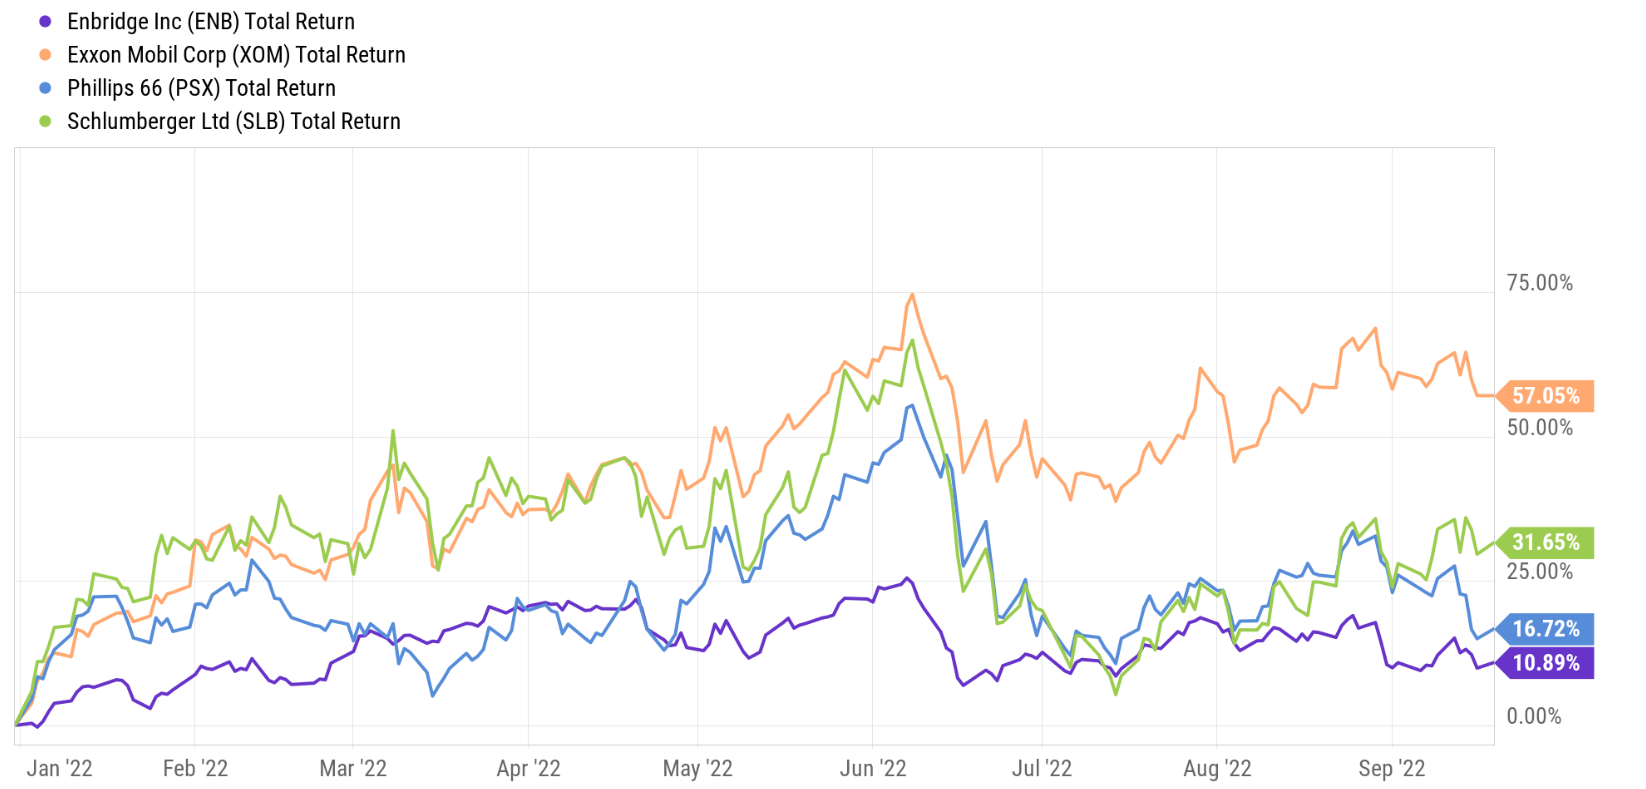
Although as aforementioned, the above positives come at a price too. The negative side is that pipeline stocks would not enjoy too much price appreciation in the case of an upward oil and natural gas price rally either. And you can see this clearly from the chart below. As seen, the large oil and NG prices rally YTD has resulted in a 57% total return for XOM and 37% for CVX. But in comparison, pipeline stocks like ENB and EPD only delivered a fraction of the total return (and a good part of the return is in the form of dividends during the same period).
Source: Seeking Alpha data
3. Refineries – PSX and VLO
Now we move on to the refineries, such as Phillips 66 (PSX) and Valero Energy Corporation (VLO). We feel that they face a mixed situation and hence we have a neutral view on them for the following considerations:
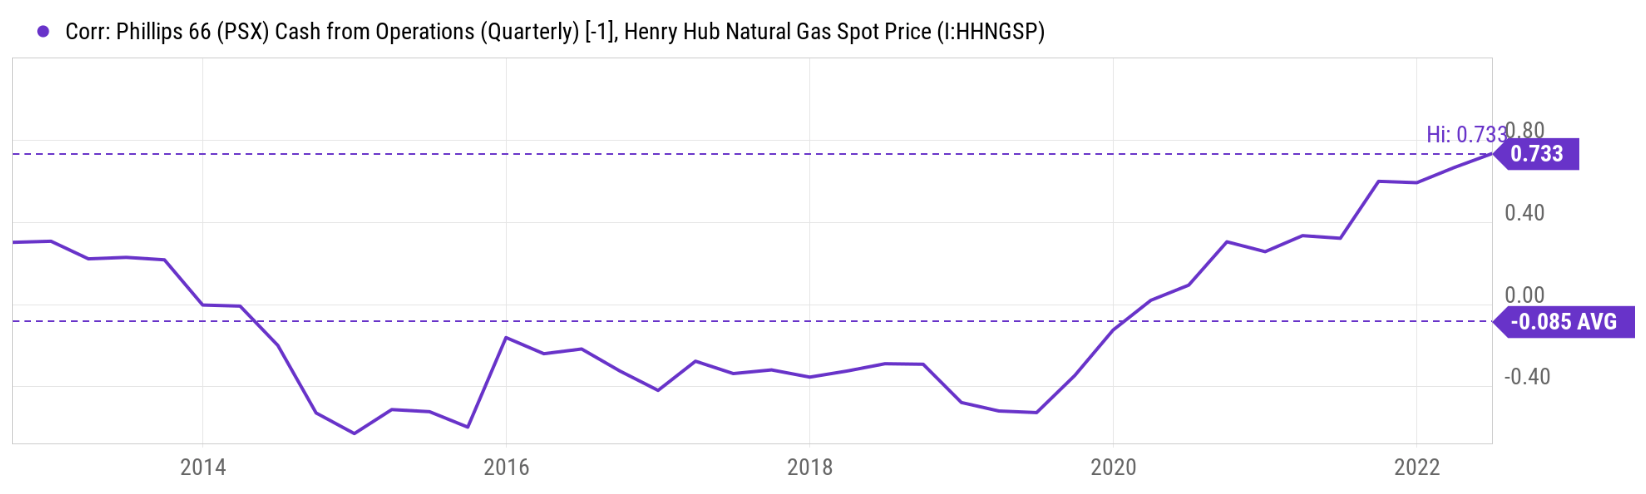
- On the one hand, refiners consume oil in their plants as feedstock, they tend to benefit when oil and natural prices fall. As a matter of fact, the traditional wisdom is to hold them together with upstream oil producers as a hedge against falling oil prices. As you can see from the first chart below, PSX’s operation cash indeed showed a slightly negative correlation (-0.085) with natural gas prices in the past as it buys NG as a feedstock for its refinery operations.
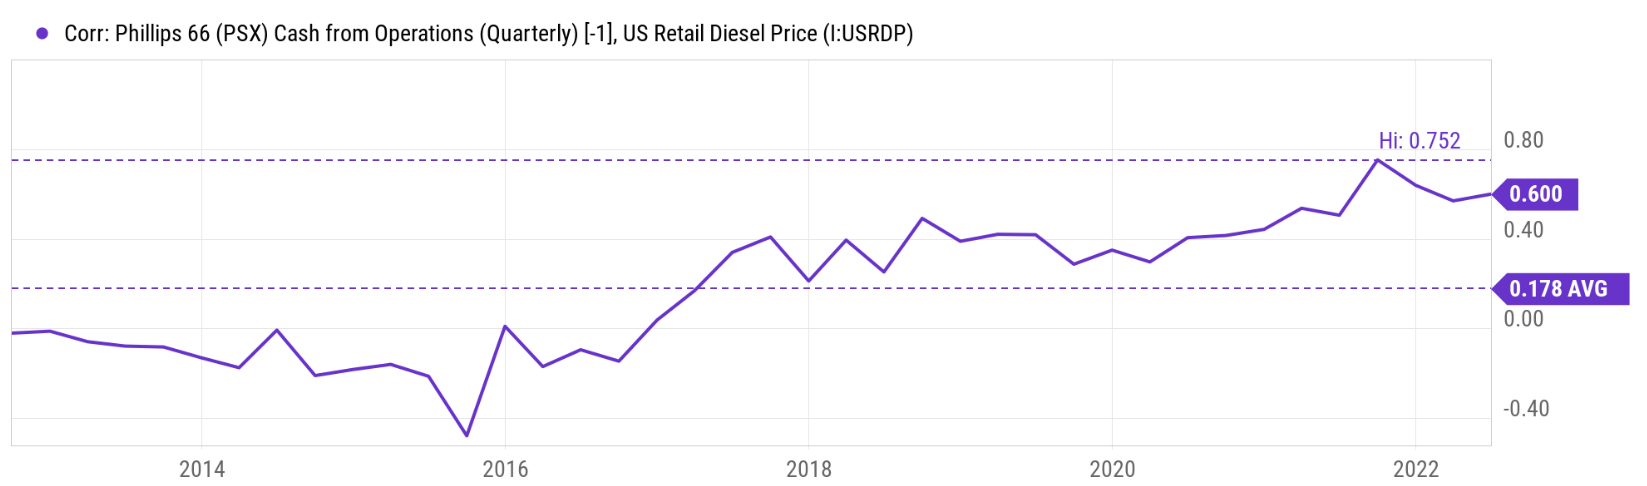
- On the other hand, their profits benefit from the prices of their final refined products (including gasoline, diesel, jet fuel, lubricants, waxes, asphalt, naphtha, kerosene, et al). Commodity prices (such as gasoline, diesel, and jet fuel) have risen substantially recently too, creating strong tailwinds. As seen from the second chart below, you can see that its operating income has been positively correlated with diesel fuel prices. The correlation coefficient has averaged positive 0.178 in the long-term and stands at 0.60 now.
- All told, their mixed responses to feedstock and end product prices make their returns also mixed as seen from the 3rd chart below. As just mentioned above, the large oil and NG price rallies YTD have resulted in a 57% total return for XOM. In contrast, PSX’s total return has been about 16%, in between the integrated players and the pipelines. And with the uncertainties, my view is that such past performance is very likely to continue into the next few years also.
Source: Seeking Alpha data
Source: Seeking Alpha data

Source: Seeking Alpha data
4. Service stocks – SBL and HAL
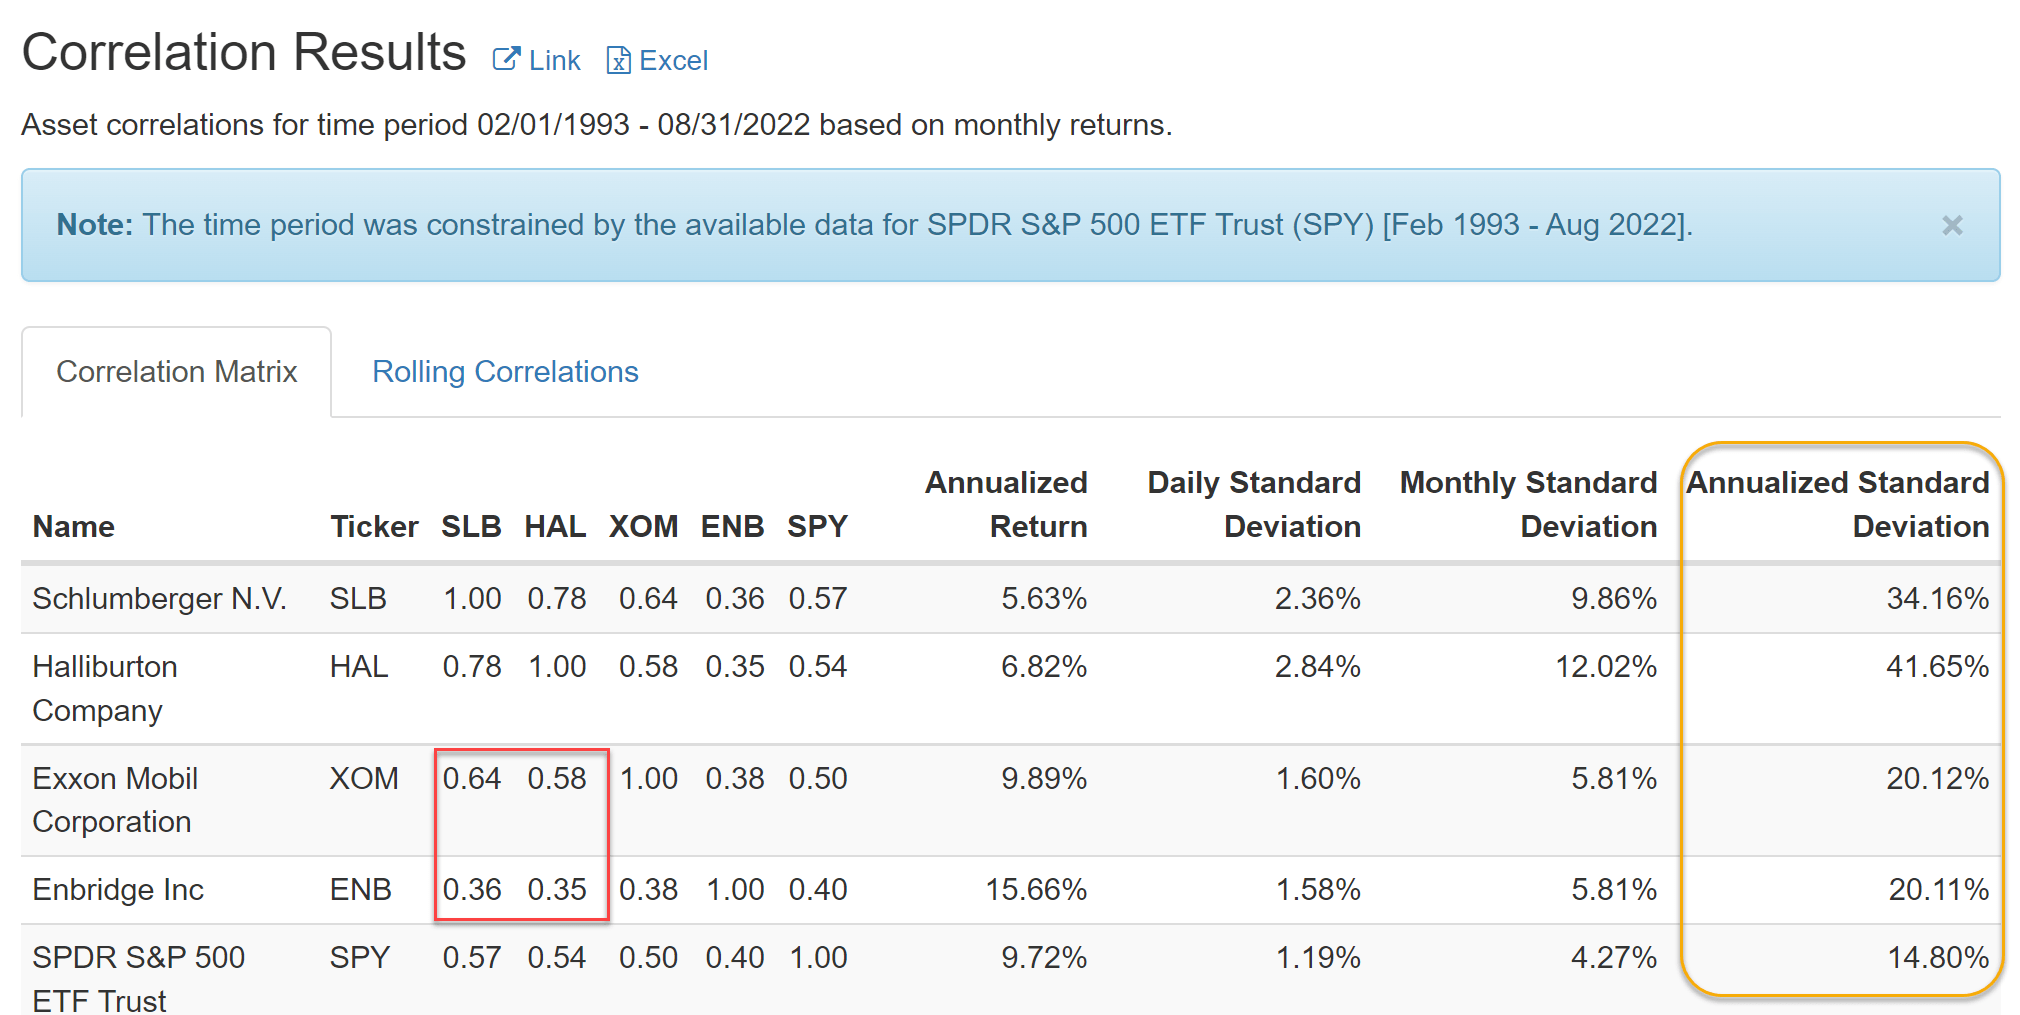
Lastly, service players, such as Schlumberger Limited (SLB) and Halliburton Company (HAL), are the higher-risk-higher-reward stocks. If the likes of XOM and CVX benefit from the first-order and second-order effects of oil and NG price rises, then the service stocks benefit from the third-order effects. Hence, they are more like a leveraged play. As you can see from the chart below, they tend to fluctuate more violently than both the integrated players and the pipelines. In terms of annual standard deviation (as highlighted in the orange box below), SLB’s annualized standard deviation has been 33%, and HAL even higher at 41%, about 2x higher than XOM and ENB (both around 19%) and about 3x higher than the overall market (about 14%)
Source: Portfolio Visualizer data
More risk-prone investors may find these service stocks appealing under current conditions. They will benefit more sensitively when the producers (such as XOM and CVX) expand on their CAPEX spendings, which is very likely to happen given the cash earned by producers and the energy shortage created by ongoing Ukraine/Russian situation. Take XOM for example. It now has plenty of cash to reinvest in future growth. It has just set annual capital spending through 2027 at $20 billion to $25 billion, a substantial boost from its already whopping $16 billion CAPEX spending this year.
Finally, there is another benefit to these stocks given their third-order response to energy prices. Due to their different responses, both in terms of magnitude and also in terms of timing, to oil and NG prices, these stocks show a relatively low correlation against other energy stocks. Therefore, they could provide an effective diversification among your energy holdings. As highlighted in the red box in the chart above, their correlation to the integrated stocks like XOM is in the 0.58 to 0.64 range, and only 0.35~0.36 to the pipelines like ENB. To put things under perspective, the entire energy sector’s correlation to the overall market is on the order of 0.65. In other words, these service stocks are LESS correlated to other energy stocks than the energy stocks themselves are to the overall market.
Source: Seeking Alpha data
Risks and final thoughts
Throughout the article, I have mentioned various risks facing each stock (geopolitical risks, sensitivity to oil and NG prices, volatility risks, et al). Besides these specific risks, here let me also point out the risks common to all energy stocks and also to my above analyses:
- First, timeframe. All the above analyses are more oriented toward the near term, say the next 1 or 2 years. As mentioned upfront, the premise of this article is that the Russian/Ukraine war will very likely last for another 200 days according to Lindy’s Law. And my oil and NG gas price projections are largely based on this premise and the near-term supply-demand imbalance.
- In the long term, climate and environmental concerns are a risk for all of them. Our concerns over climate change and the environment could impact oil and gas production in general. All major energy stocks are often involved in legal disputes with environmental groups, protests, lawsuits, and government regulations. I am certain that each of them will all have a role in our renewable energy future, but their role will be different and merits a separate article.
- Macroscopic risks. All energy stocks also face the same macroscopic risks. Besides the Ukraine/Russian war, there is also a possibility for a resurgence of the pandemic and/or a global economic recession. These possibilities could alter the demand-supply dynamics dramatically.
To conclude, the Russian/Ukraine war significantly disrupted the global energy supply. Since the war broke out, oil and natural gas prices have not only surged substantially (by 63% and 191%, respectively, YTD) but also gyrated widely. Such extreme gyrations can create enormous uncertainties for energy investors. To make things worse, such gyrations are very likely to continue. And it is the goal of this article to provide a more comprehensive overview of energy stocks so investors can be better prepared. More specifically, my thesis is that:
- Integrated players with an emphasis on production, such as XOM, are the ones best poised to weather these uncertainties and benefit if oil/NG prices go up. Under a conservative assumption of a $95 oil price and a valuation of 9.5x cash flow, a target price in the triple digits can be easily supported for XOM.
- Pipeline players, especially those located in Canada and the U.S. (such as ENB, ET, and EPD) are the most insulated to the oil/NG price fluctuations with their middle-man role. And their concentrated geographical exposure best shields them from global geopolitical risks. Finally, their generous and safe dividend yield provides further protection. For example, ENB is currently yielding 6.51%, substantially above both XOM (3.82%) and also the energy sector represented by XLE (3.99%).
- Refineries, such as PSX and VLO, face a mixed situation, and we have a neutral view of them. Their mixed responses to feedstock and end product prices make their returns also mixed. And with the uncertainties, my view is that such past performance is very likely to continue into the next few years also.
- Finally, service providers, such as SLB and HAL, can be viewed as a leveraged play for more risk-prone investors. If you can stomach the risks and volatilities, they have a few positive catalysts afoot under current conditions. Integrated players such as XOM and CVX are expected to boost their CAPEX investments in the near future. And overall, the energy sector has been underinvesting structurally for years and I expect the catchup to last for a while.