
Chunumunu
In March 2022, I published my last article about Morningstar, Inc. (NASDAQ:MORN) and stated that Morningstar was still too expensive. Back then, the stock was trading for $283, and now at the time of writing Morningstar is trading for $215 – a decline of 24%. And after losing another quarter of its value, the question seems justified if Morningstar is now cheap enough or if we have reached at least its fair value. Especially when considering that Morningstar lost 38% since it was trading for $350 about one year ago.
Quarterly Results
Morningstar reported solid results for the second quarter of fiscal 2022. Revenue could increase 13.2% year-over-year, from $415.4 million in the same quarter last year to $470.4 million this quarter. And operating income could also increase from $47.2 million in Q2/21 to $53.9 million in Q2/22 – resulting in 14.2% YoY growth. And diluted net income also increased from $0.70 in Q2/21 to $0.76 in Q2/22 – resulting in 8.6% YoY growth.

Morningstar Q2/22 Presentation
However, when looking at adjusted operating income, we see a decline of 23.9% year-over-year to $73.4 million. Free cash flow declined even 65.9% year-over-year from $108.5 million in the same quarter last year to $37.0 million this quarter. And finally, average assets under management and advisement increased 4.6% YoY to $258.9 million.
When looking at the three different types of revenue, the biggest part of revenue is still stemming from licensed-based revenue ($327.5 million) and was growing 18.1% year-over-year. Asset-based revenue was $67.6 million (4.3% year-over-year increase) and transaction-based revenue was $75.3 million (2.6% year-over-year increase).

Morningstar Q2/22 Presentation
Growth is especially driven by licensed-based revenue. One of the main drivers of growth right now is PitchBook. Quarterly revenue from PitchBook doubled within only two years, and YoY license growth is still 37.5% while year-over-year organic revenue growth is even 46.7%.
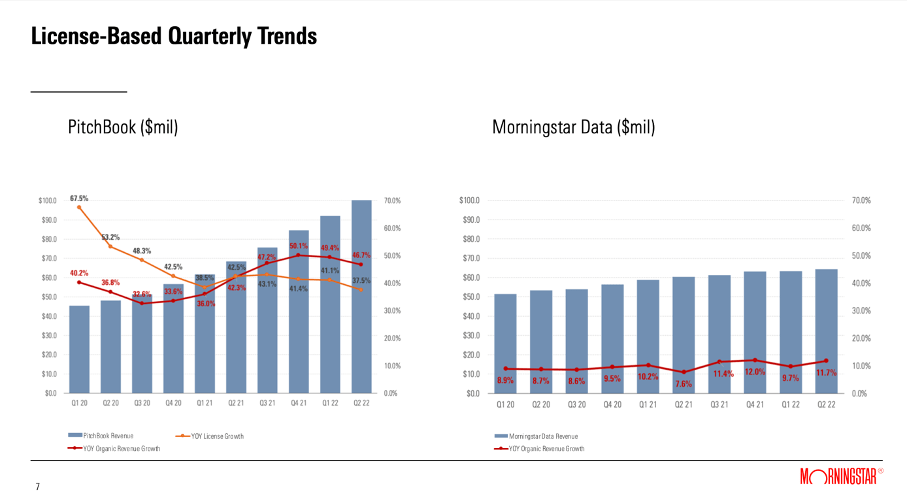
Morningstar Q2/22 Presentation
LCD Acquisition and Balance Sheet
In April 2022, Morningstar also announced its plans to acquire Leveraged Commentary & Data (“LCD”) from its competitor S&P Global Inc. (SPGI). LCD is the industry standard for news, research, databases, and indexes for the leveraged finance market. And, according to Morningstar, it goes along with its goal to bring transparency to the private credit market. The leveraged loan market data provider will be integrated with Morningstar’s PitchBook platform, and more than 60 LCD employees will become part of the PitchBook team.
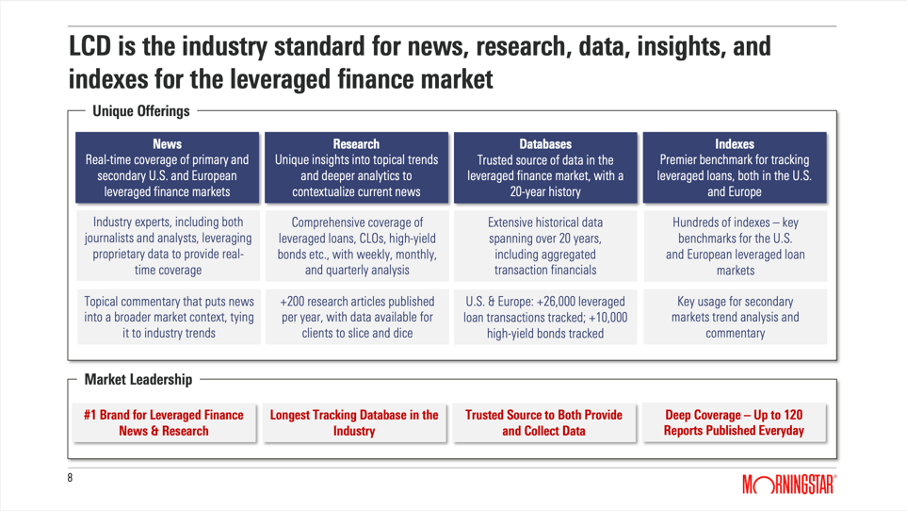
Morningstar LCD Acquisition Presentation
The price for the acquisition was $650 million (with a payment of $600 million at closing and a contingent payment of up to $50 million six months after closing). When considering that LCD generates about $56 million in annual revenue, Morningstar paid 12 times sales for the business – and it certainly can’t be called a bargain.
Balance Sheet
And, of course, the acquisition influenced the company’s balance sheet. On June 30, 2022, Morningstar had $1,147 million in long-term debt as well as $29.4 million in short-term debt. When comparing the total debt of $1,169 million to a total equity of $1,241 million, we get a D/E ratio of 0.94. While this D/E ratio might seem acceptable, we can also compare the total debt to the adjusted operating income of the last four quarters, which was $251.2 million. When calculating with that amount, it would take about 4.7 years to repay the outstanding debt – this is a rather long time to repay the outstanding debt.
However, we must consider $380.2 million in cash and cash equivalents on the balance sheet. When subtracting that amount from the total debt, it would take only a little more than 3 years to repay the outstanding debt, which seems acceptable. The balance sheet of Morningstar is certainly not perfect after the acquisition, but there seems to be no reason to worry, either.
Declining Fundamentals?
When looking at the twelve months trailing numbers, we can see Morningstar revenue growth being rather stable, while gross revenue is also still growing at a solid pace. However, growth is slowing down for gross revenue as well as operating income– in the last few quarters, operating income growth declined from 75% four quarters ago to a 12% decline right now (always using TTM numbers).
When looking at the quarterly margin trends, we also see a declining gross margin since Q3/20. Gross margin declined from 25.6% in Q3/20 to 15.6% in Q2/22. And when looking at the operating margin we can also identify a downtrend. And although we are only looking at a few quarters, declining margins are never a good sign.

Morningstar Q2/22 Presentation
And as I have explained in previous articles, I would be rather cautious about Morningstar in the coming quarters and years. Although Morningstar performed quite well during the Great Financial Crisis, we don’t know what the next potential recession might bring for Morningstar.
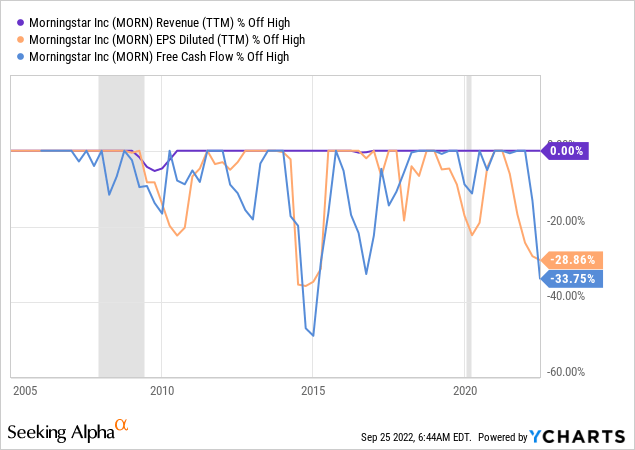
When looking at the past performance of Morningstar, we have data for the last, rather untypical recession in 2020 and for the Great Financial Crisis. And when looking at the Great Financial Crisis, Morningstar was affected by the recession, but performed quite well. Revenue declined about 5% and free cash flow as well as earnings per share declined about 15-20% – a solid performance during a recession. But as Morningstar is getting more mature over time, I assume declines will be steeper in coming recessions.
And usually, financial service companies are affected by recessions and especially bear markets. Investors pull off capital, the demand for financial services declines, and this has an effect on revenue – for Morningstar as well as other financial service companies.
Intrinsic Value
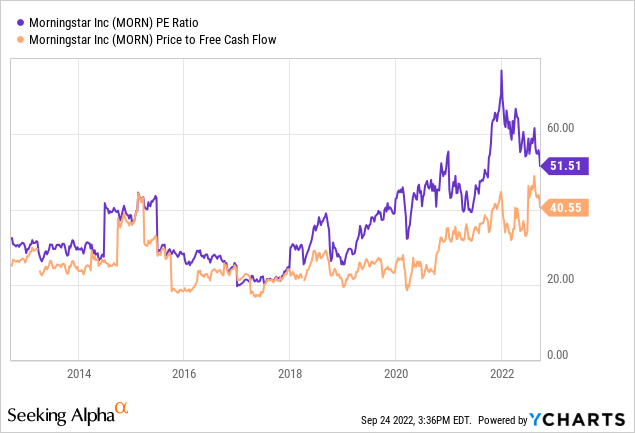
And a major problem remains for Morningstar. The stock is still trading for a P/E ratio of 52 and for 41 times free cash flow. And while such high valuation multiples are almost never justified for a business, extremely high growth rates would be a starting point to justify them.
When looking at analysts’ estimates for Morningstar in the next few years, these high growth rates are actually expected. According to Seeking Alpha, analysts are expecting growth rates between 20% and 35% in the next few years, but in my opinion these growth rates are not realistic. We could argue that the P/E ratio declined in the last few months from a P/E ratio of almost 70, but in my opinion, it doesn’t really matter if a stock is trading for 50- or 70-times earnings. In both cases a stock is overvalued!
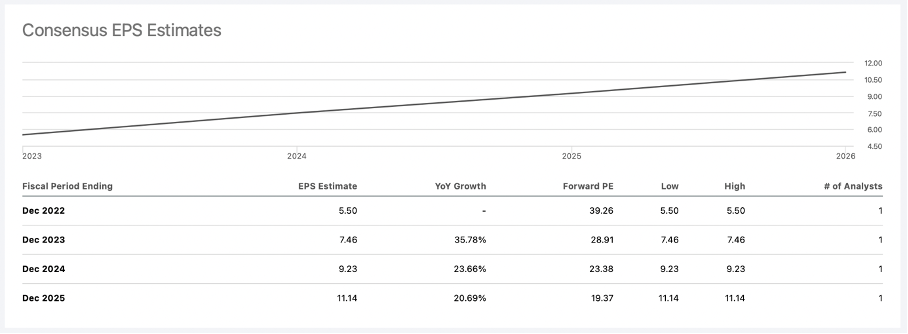
Seeking Alpha Earnings Estimates
Additionally, we can also use a discount cash flow calculation to determine an intrinsic value for Morningstar. In the last four quarters, Morningstar generated $231 million in free cash flow, and when taking that amount as basis for our calculation, Morningstar must grow its free cash flow about 13% annually for the next ten years, followed by 6% growth till perpetuity to be fairly valued. However, in the last ten years, Morningstar could grow earnings per share only with a CAGR of 8.77% and 13% annual growth for the next ten years seems like an extremely optimistic assumption.
On the one hand we should also point out, that Morningstar could generate $350 million in free cash flow in fiscal 2021 and $308 million in fiscal 2020 and the free cash flow of the last four quarters might not be representative of the business. On the other hand, we should also not forget the looming recession on the horizon, and we must assume that earnings per share as well as free cash flow might decline in the coming quarters. It might also take a few years before Morningstar will reach pre-crisis free cash flow levels again and growth rates in the years following the crisis might be slower (similar to the years after 2009).
In my opinion, Morningstar can be seen as almost fairly valued at this point. In my last article, I calculated an intrinsic value around $200 by using rather cautious assumptions. But the stock is not a bargain, and certainly not a screaming buy, and I see further downside risk for the stock.
Entry Points for Morningstar
When looking at the chart of Morningstar, we can identify several support levels at which the stock could be bought. A first strong support level can be found between $150 and $165. At $151 we find the 38% Fibonacci retracement of the last bullish wave (which started in 2009) and at around $165 we have the highs before the COVID-19 crash.
A second strong support level can be found between $85 and $100. At $100, we have several strong indicators that might support the stock. Not only can we find the lows of December 2018/January 2019 and the COVID-19 lows, but we also have a long-term bullish trendline at around $100 (yellow line). Additionally, at $103 we find the 23% Fibonacci retracement, and these indicators combined should lead to a strong support level. And when going a little lower, we find the highs of 2007 as well as the highs of the years between 2013 and 2016 around $85.
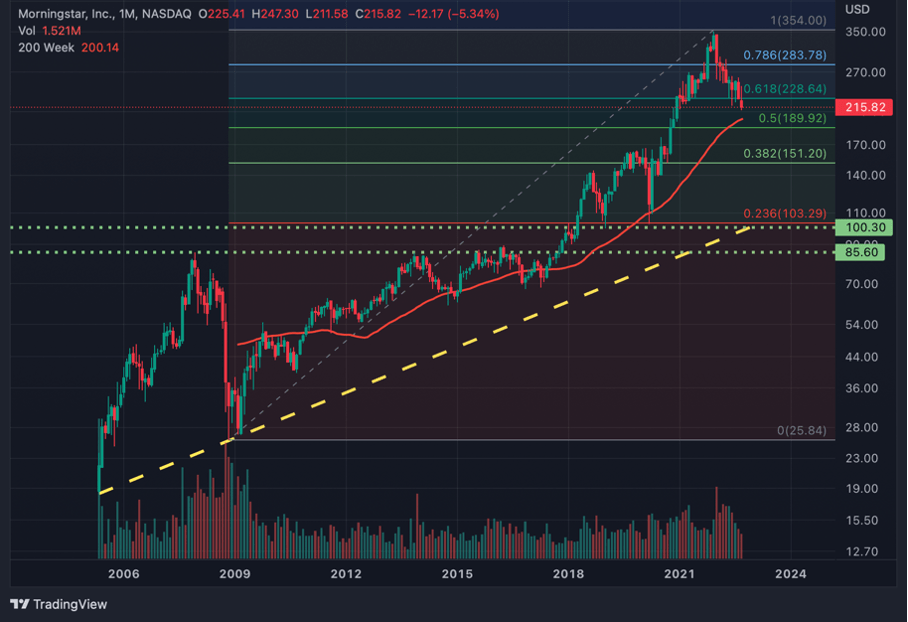
TradingView
Of course, Morningstar must decline more than 50% from the current price levels to reach $100 and this would be a decline of more than 70% from previous all-time highs. But first, the company declined 68% during the Great Financial Crisis and a similar decline is not unlikely. And second, when taking the expected earnings per share for fiscal 2022 ($4.19), we get a P/E ratio of 23 when the stock would be trading for $100 – and a stock trading for 23 times earnings is still not cheap.
Conclusion
When using a discounted cash flow calculation, Morningstar might seem almost fairly valued right now. But the stock is still trading for 40 times free cash flow and 50 times earnings. This is certainly not cheap and might indicate that the assumptions we used in the intrinsic value calculation might be too optimistic. For the long term, Morningstar has a solid, subscription-based business model which should generate stable (or increasing) cash flows – but for the next few years, the looming recession and bear market will most likely have a negative effect on the business. Morningstar stock declining further seems like a possible scenario.