
Jose Ignacio Martin Del Barco/iStock via Getty Images
It is usually inadvisable to catch falling knives. That is, without a little magic. Comcast Corporation (CMCSA) looks to be doing its own magic, by making investor capital disappear.
The price chart appears to be a series of falling knives, causing investors to scramble under duress. Since February of last year shares have declined by more than 50%, spending most of that time well below all major daily moving averages. Shares are now at a record low distance from the 52-week moving average at -15.00. It has been hard to watch.
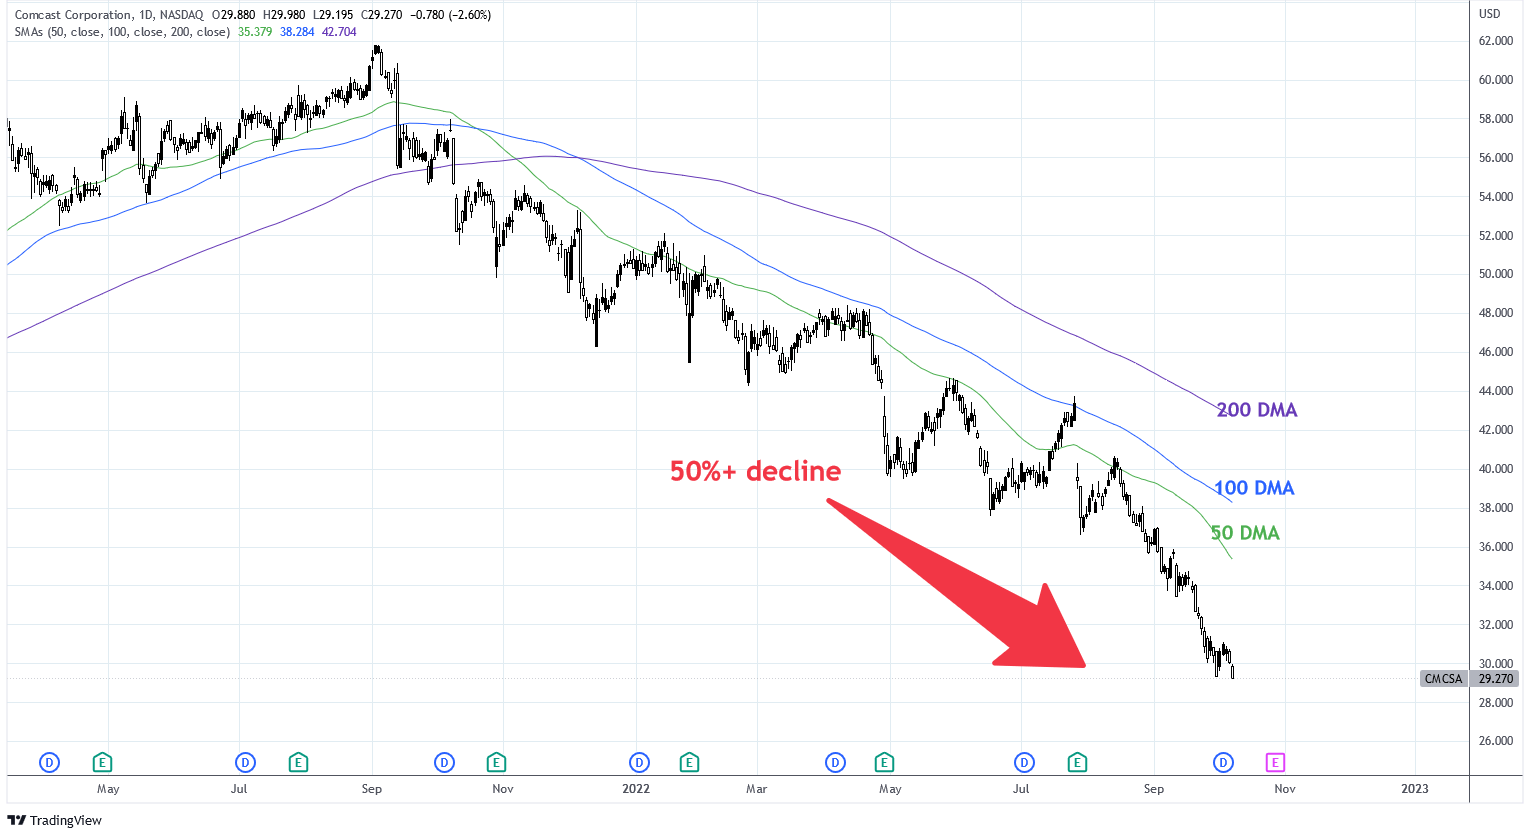
Charts by TradingView (adapted by author)
Contrary to shareholder sentiment, authors on Seeking Alpha are overwhelmingly bullish on CMCSA. Over the past month, 12 of 13 authors who have published about the company were bullish. It causes one to wonder, what do they see?
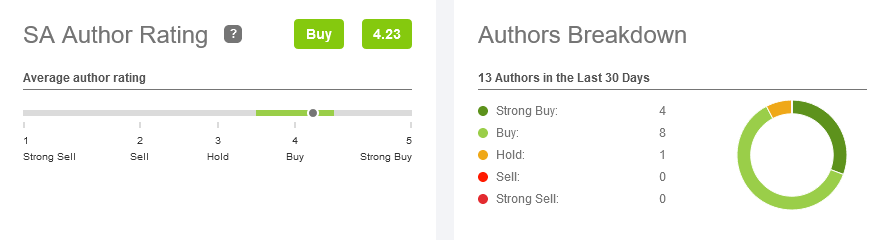
Seeking Alpha
Shares of Comcast appear to be great value because they trade at low price multiples including P/FCF, EV/EBIT, and P/S. The issue is that higher risk-free rates justify the low valuations. In addition, near-term growth is looking unreliable.
However, we’ve reached a point where sentiment has priced in the bad news. Share price has acknowledged risk-free rates. Risk premium has expanded in anticipation of further rate hikes and slower growth. The fundamentals look bleak and in the short-term shareholders should expect more volatility. But these conditions make for a great contrarian trade, so count this author as number 13.
Sentiment Is Bearish
It may be hard to believe that Comcast has underperformed the S&P 500 by more than 20% in a year when the S&P is down more than 20%. Unfortunately, it’s true. The company tracked the index until July and then the wheels fell off when Q2 earnings were released. The market was disappointed that the company announced its first decline in residential broadband users in contrast to expectations for a strong increase in users, fueling fear that the cable market is doomed.
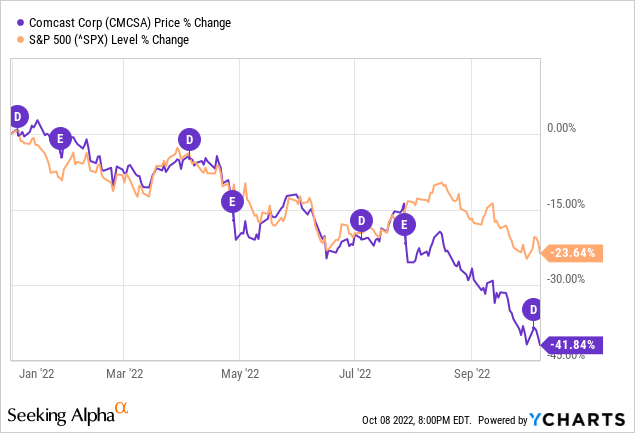
Seeking Alpha
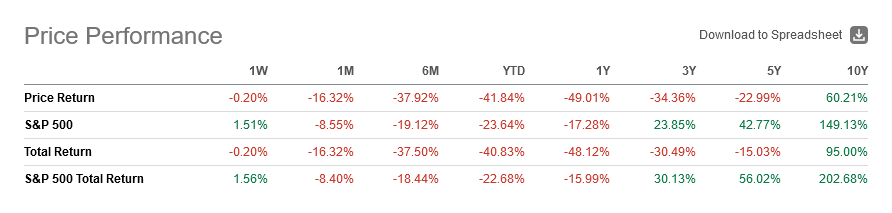
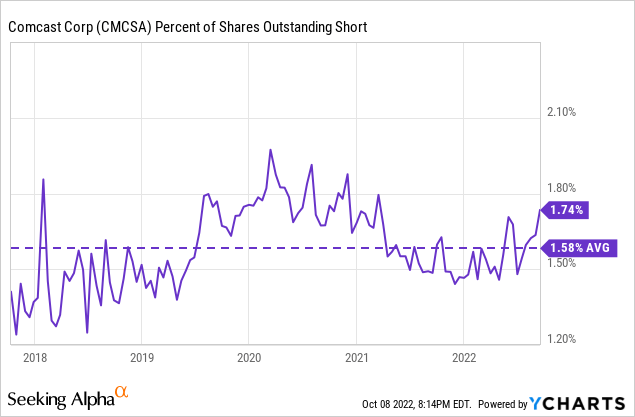
On a total return basis, CMCSA has underperformed the S&P 500 over the past 10 years. It has left much to be desired for shareholders. Following the earnings release, short interest climbed back up above the 5-year average of 1.58%.
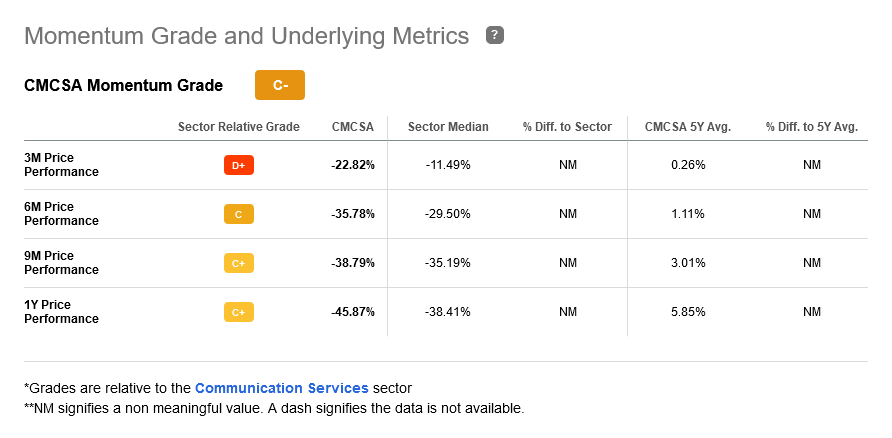
Share momentum continues to degrade with an overall SA Momentum Grade of C- and the 3M price performance at a miserable D+, under-performing the sector by almost 2x.
Seeking Alpha
Breaking Down the Decline
There are many theories about why CMCSA is performing so poorly. Much of which is related to subscriber growth and market competition. There is one explanation that should not be overlooked.
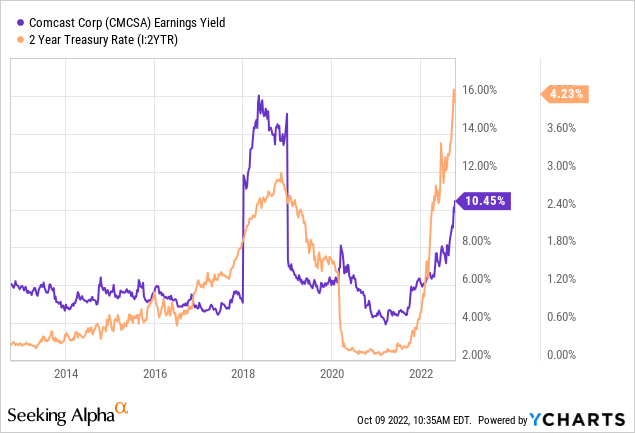
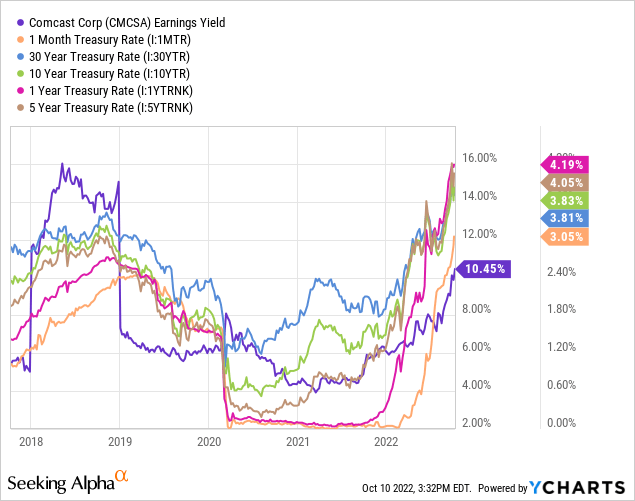
Since the beginning of the year rates on U.S. Treasuries have surged. The yield on the 1-year Treasury was essentially nothing a year ago and today it is over 4%. This rise in risk-free rates is pushing Comcast’s earning yield up by pulling the share price down. Notice how the CMCSA earnings yield begins to climb in tandem with the 2-year Treasury rate:
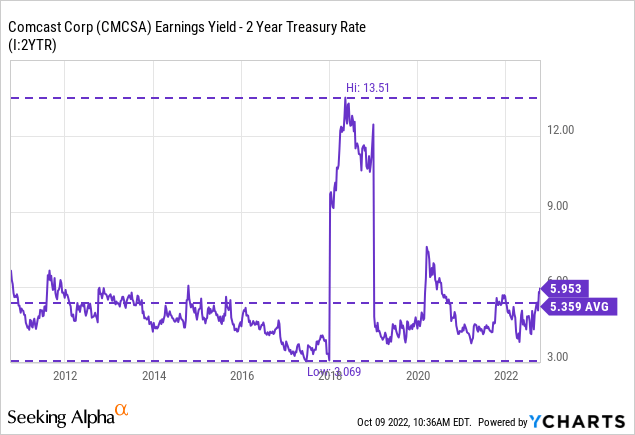
The difference between the earnings yield and the 2 year Treasury rate demonstrates the risk premium for CMCSA. Risk premium has expanded to 5.95% which is above the 12-year average of 5.35. Risk premium for CMCSA is typically between 3-6%. The current risk premium offers an above average return for investors but also indicates that the market is anticipating higher risk.
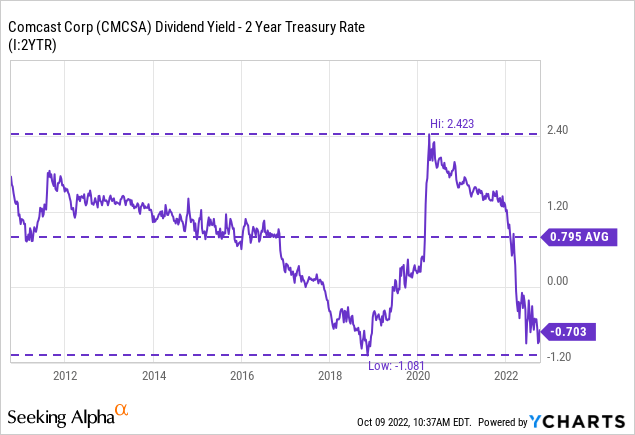
Another way to view risk is in the context of the spread between the dividend yield and risk-free rates. The dividend yield for CMCSA is currently 0.7% below the 2-year Treasury. This helps explain why shares have experienced such weakness as the market tries to maintain a reasonable spread between yield and rates. Over the past 12 years the market has tended to price CMCSA’s dividend yield at 0.795% above the 2-year Treasury rate. For context, share price would need to be $22.65 for the dividend yield to equal this average.
Clearly, the majority of share price weakness is due to rising risk-free rates. Over the past few quarters, risk premium has begun to expand which indicates that the market is anticipating greater risks. Included in those risks is the risk of refinance and slower growth.
Debt and the Risk of Refinance
Comcast carries a substantial debt load with net debt equal to $91.891B compared to a market cap of $129.18B. The company’s debt to equity ratio is 1.04 with a leverage ratio of 2.3x. These are not unmanageable debt obligations but they are significant enough that I want to discuss them upfront.
The following includes data from the company’s website adjusted for current Forex exchange rates and LIBOR rates, excluding the debts denominated in CNY. According to my calculations, this long-term debt has a weighted average maturity year of 2038 at a weighted average rate of 3.5%. The chart below displays the debt structure according to year of maturity, interest rate, and loan size in millions of USD.
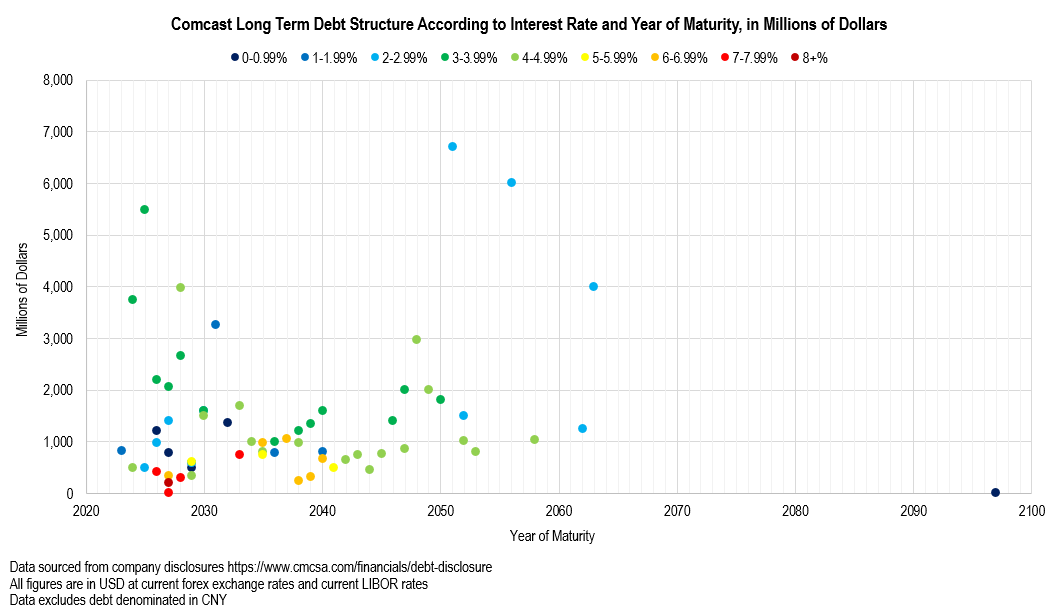
Chart by author (data from Debt Disclosure | Comcast Corporation)
The concern is that because rates have risen so much that when CMCSA needs to refinance its debt this will raise the cost of financing and wound profit margins. The potential exists, however, CMCSA only has $0.824B in long-term debt coming due in 2023 and $4.25B due in 2024. Higher rates will impact the company’s ability to procure new debts and have an impact on growth, but the risk of refinance is relatively minor in the short term. Trends in debt-to-GDP and demographics leads me to expect a decline in interest rates over the next 1-3 years.
Share Buybacks or Debt Repayment?
In September, Comcast announced the authorization of an additional $20B in share repurchases, equal to about 15.5% of market cap, after the company has already repurchased $9B year to date. The move has received criticism from shareholders who believe that the capital would be better used to repay some of the debt or raise the dividend. In my opinion that would be a mistake.
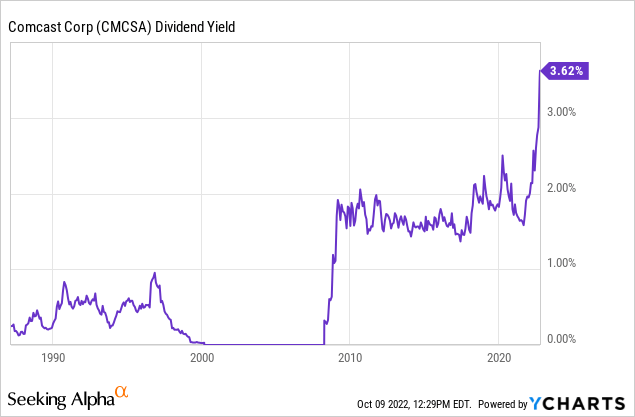
The dividend yield is now 3.62% which is the highest dividend the company has ever offered. The payout ratio sits at 29.6% and is due to rise if the company experiences negative growth. CMCSA has raised its dividend for 21 consecutive years at a CAGR of 13.26%. The dividend growth is healthy and accelerated growth is both unwarranted and unadvised given the current macroeconomic environment.
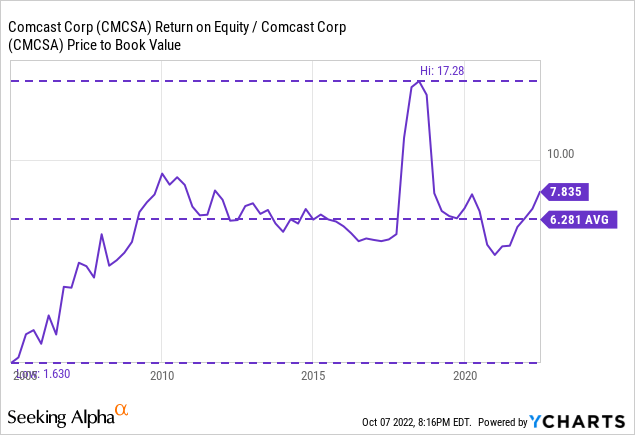
With debt to equity at 1.04x I like to examine share repurchases by comparing the cost of financing with the price-adjusted return on equity. Notice in the chart below that return on equity over the past 10 years has maintained around 16% and is currently at 14.84% while the price to book ratio has fallen sharply to 1.413 which is the lowest in a decade.
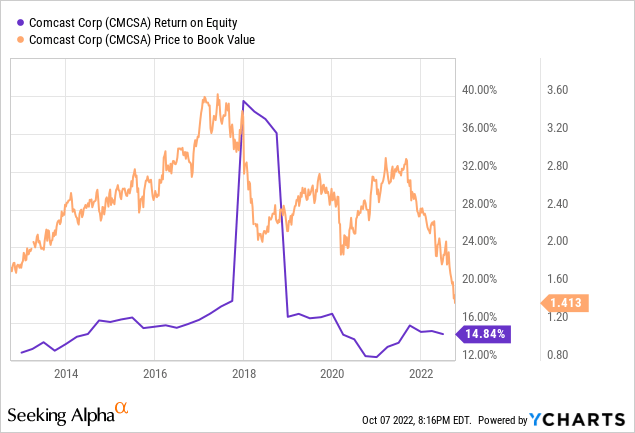
The price-adjusted return on equity, represented by ROE divided by P/B, has been consistent since 2010 with an average of 6.281%. Today, the adjusted ROE has drifted to 7.835%. When this yield is higher than the debt interest rate, I tend to favor share repurchases over debt repayment. Compared to the $20B in authorization, CMCSA only has $0.627B in long term debt that has an interest rate above that yield.
The decision to repurchase shares depends on the cost of debt, current interest rates, level of risk premium, and adjusted ROE, among others. The following conditions are favoring share repurchases over debt repayment:
- Current interest rates are higher than the average cost of debt.
- Risk-free interest rates are relatively high resulting in a stronger earnings yield.
- Adjusted ROE is above average and higher than the cost of debt.
- The risk premium spread is higher than average.
I expect that share repurchases will help to curtail the expansion of risk premium better than repayment of debt, which is in the best interest of shareholders.
Cord Cutting Threatens To Cut Profits
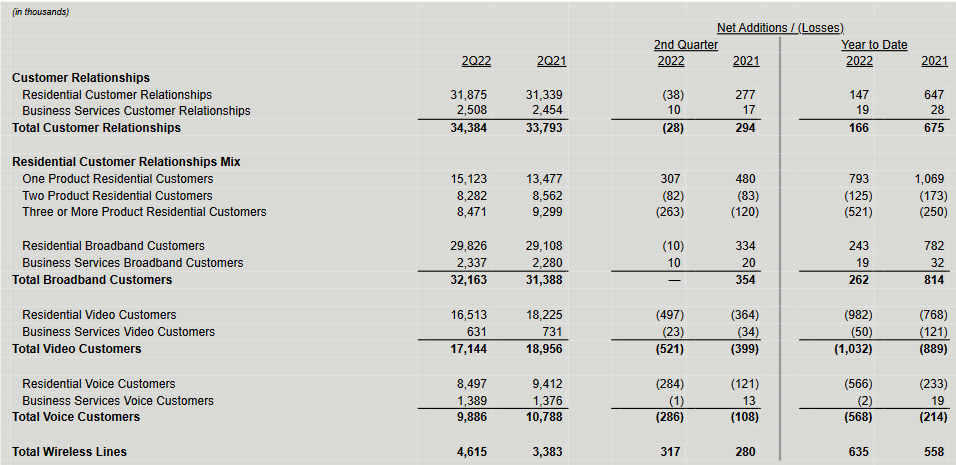
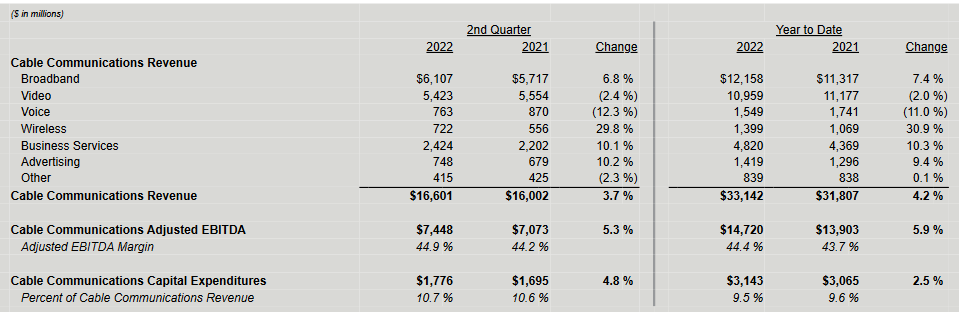
The company reported a loss of 38,000 residential customer relationships in Q2. The decline has sparked concerns of a broader trend in customer declines. In addition, net losses to video customers were 521,000. While the outcome is not ideal it is important to consider the time frame and circumstances.
Despite the decline, residential customer relationships in Q2 2022 are still 1.7% higher YoY and total broadband customers are 2.5% higher YoY by adding 800,000 new subscribers over the past year. Year to date net losses to video customers is 1.032M and to voice customers is 0.568M while net adds to wireless lines is 0.635M.
Seeking Alpha (company Form 8-K)
Overall, growth is slowing. Broadband subscriptions did not increase in Q2 and all other segments, except wireless, experienced customer declines. This is not very surprising given macroeconomic conditions.
I wrote about the degrading state of the consumer previously. Signs are indicating that U.S. consumers are struggling financially and the result is higher credit balances and lower savings rates. Consequently, it should be expected that consumers will cut back on discretionary spending, including entertainment and telecom, when their budget is tight.
Data from LendingClub indicates that about 60% of U.S. consumers are living paycheck to paycheck which has increased from 57% a year ago. The table below shows how the percent of consumers living paycheck to paycheck has changed from August to May of 2021 according to income level:
| Consumer Income | August 2022 | May 2021 |
| <$50,000 per year | 75% | 71% |
| $50-100,000 per year | 62% | 53% |
| >$100,000 per year | 45% |
39% |
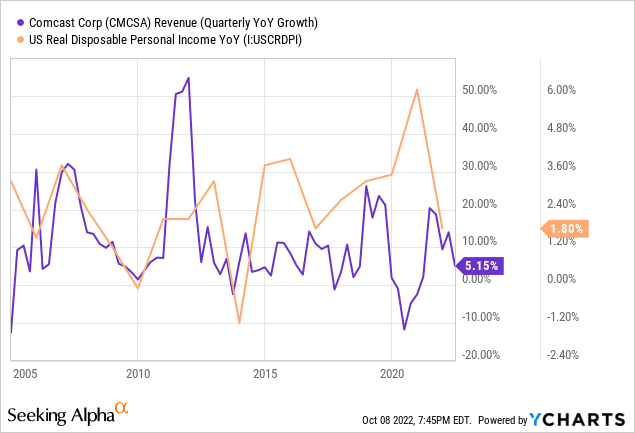
By now, everyone understands the deleterious effects of price inflation and consumers are having to make choices. This is why CMCSA revenue growth expresses a correlation with changes in real disposable personal income. Notice how a decline in real disposable personal income in 2010, 2014, 2017, and 2022 corresponded to declines in company revenue.
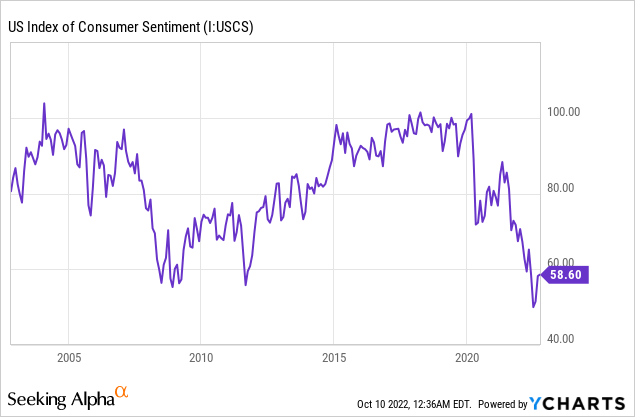
Notice how Consumer Sentiment is testing lows of the 2008 recession:
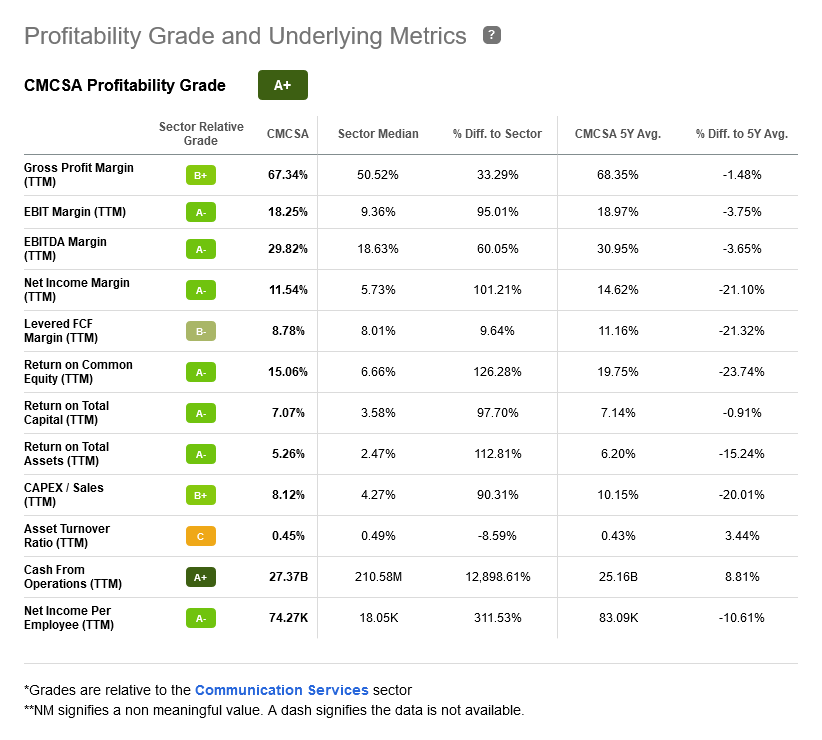
It seems apparent to me that these losses in customer relationships is due to economic conditions more than competition. CMCSA maintains strong profit margins in the industry with a net income margin of 11.5%. CMCSA earns an A+ profitability grade from Seeking Alpha due to its superior performance. It suggests that Comcast’s customers continue to find substantial value from their services. During the Q2 earnings teleconference call, this is what CEO Brian Roberts said regarding competition:
We are not seeing fixed wireless have any discernible impact on our churn, but its early growth appears to be another contributor to our lower connect activity. In addition, we continue to compete against fiber in an increasing percentage of our footprint.
Next, we will continue to aggressively compete for market share. We offer a superior product focused on innovation and differentiation and we continue to increase the value of broadband by bundling it with mobile and flex. And we are making great progress in our network transition to DOCSIS 4.0, which gives us a clear path to reaching multi-gigabit symmetrical speeds at scale faster and at a lower cost relative to our competitors, all within the CapEx intensity levels we have previously outlined.
Seeking Alpha
Given this, I believe that the weakness in customer relationships is primarily a function of underlying economic conditions. The media and communications sector is highly competitive and although CMCSA is experiencing weakness due to competition it appears that the decline in customer relationships is not that unexpected.
Growth on the Knife Edge
American households and businesses are demanding higher internet speeds, especially in light of the increased prevalence of telework and the need for quality video streaming. This presents a challenge for CMCSA as fiber optic technology offers faster download and upload speeds at a lower maintenance cost than current broadband.
Comcast is leading the industry in its effort to deploy DOCSIS 4.0 technology to address this issue and offer speeds up to 10 Gbps downstream and 6 Gbps upstream. This is a significant improvement to speed that will improve Comcast’s competitiveness because the cost of deployment is relatively lower due to adaptation of existing infrastructure. In January 2022, Comcast successfully tested a version of the DOCSIS 4.0.
This is what CEO Brian Roberts said about the new technology during the Q2 earnings teleconference call:
…we believe that our path to deliver multi-gigabit speeds together with the other features and functionality we offer will make our broadband experience superior to any of our competitors over the long-term.
Comcast Deputy CFO & Treasurer Jason Armstrong said this during the Bank of America Media, Communications & Entertainment Conference 2022 (bold added for emphasis):
There’s a pipeline of DOCSIS that would say mid splits and then DOCSIS 4.0 right behind it, gives us sort of an ultimate end goal of multi-gig symmetrical across our base.
And today, we gave a little bit more clarity on mid splits. We’re actually in the market right now in mid splits. We expect to have 20% of our base equipped by the end of the year. That’s going to mean multi-gig download speeds, and it’s going to mean 5x to 10x improvement in upload speeds. So it will be 20% of our base, that’s about 34 markets by the end of the year. And then we’ll be substantially through our footprint by the end of 2025.
And then DOCSIS 4.0 leverages and sits on top of that and is right behind it. So new news today is second half of 2023, we’re going to be in the market with DOCSIS 4.0 and rolling out different geographies. And that is a technology that’s going to allow us to have multi-gig symmetric in the market, which can effectively compete against anything.
He also stated:
…fiber is the real long-term competitor. And it always has been. Our view hasn’t changed. It’s a very viable competitor.
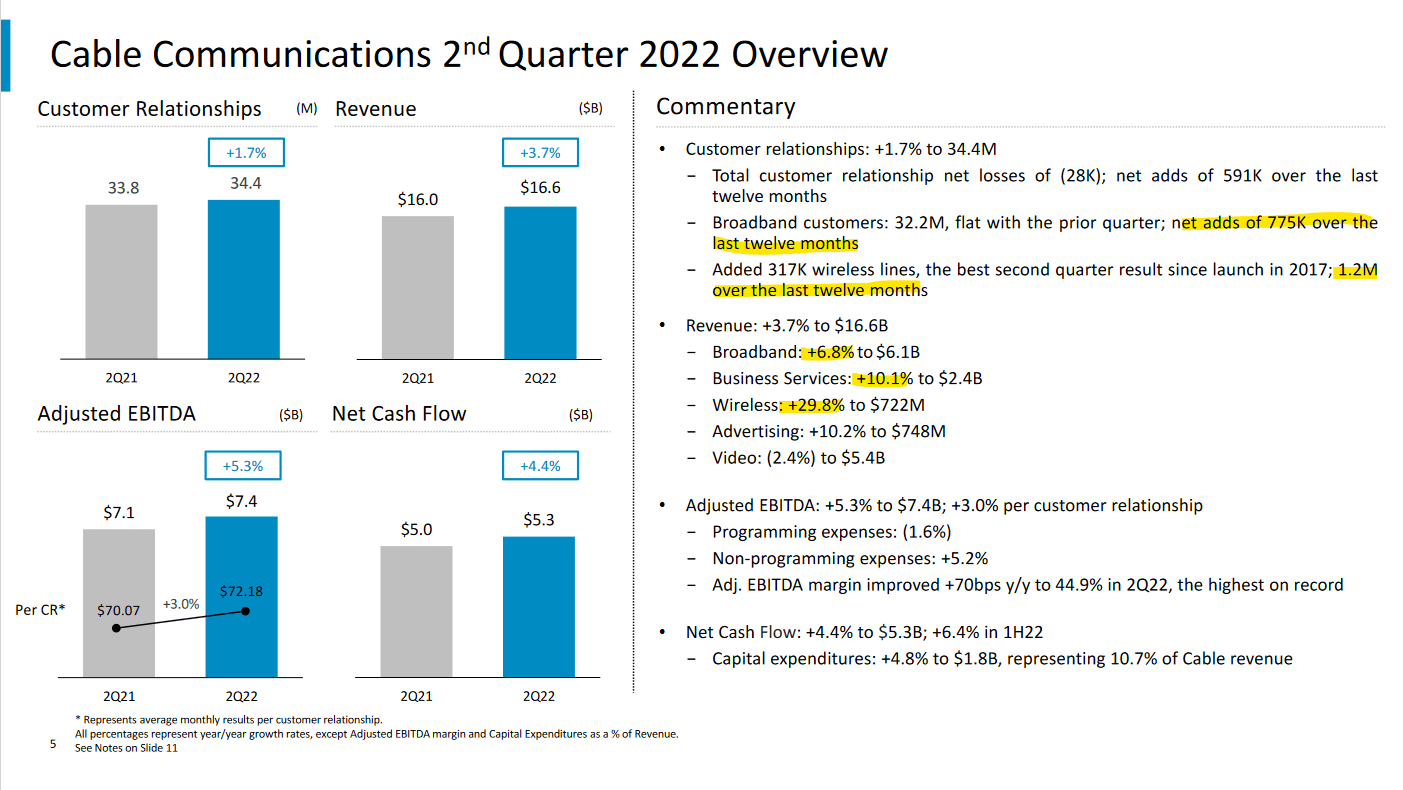
Clearly, Comcast is identifying where customers are seeking value and making a strong effort to meet that demand and continue to be an internet provider of choice. While its competitiveness is improving Comcast will still experience headwinds to growth for the reasons discussed. Broadband is a significant segment consisting of 36.7% of cable revenue and 20.3% of company revenue.
Seeking Alpha (company Form 8-K)
Interestingly, the company is experiencing growth in other segments. While broadband added 775,000 customers over the last year wireless has added 1.2 million customers. Broadband revenue increased by 6.8% in that time while Business Services revenue increased 10.1%, Wireless revenue increased 29.8%, and Advertising revenue increased 10.2%. Notably, the Video segment experienced the greatest weakness with revenues declining 2.4% YoY.
Seeking Alpha (company Q2 2022 presentation)
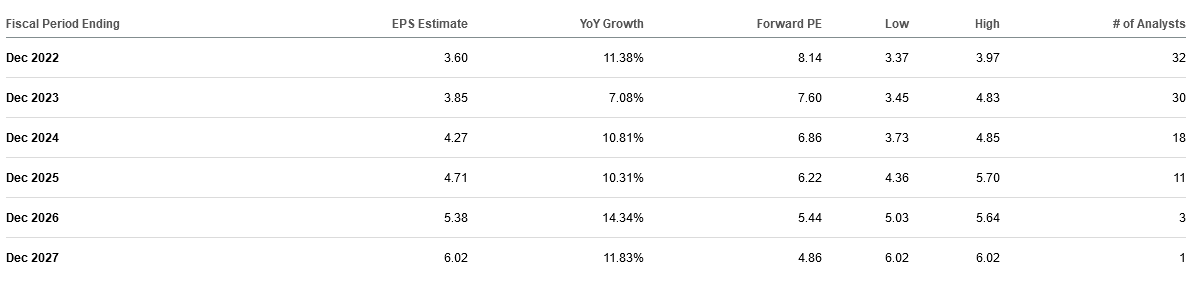
Earnings estimates remain strong according to SA analysts. Consensus EPS growth by 30 analysts is 7.08% in 2023. I think these expectations are too generous for 2023 given the fundamentals. I am expecting negative-to-flat earnings growth in 2023.
Seeking Alpha
Valuation: Low or Cheap?
With CMCSA trading at the lowest share price since 2016 and the highest dividend ever, it would seem that CMCSA is cheap. But there are many factors to consider, including future growth and higher risk-free rates which warrant lower valuations. To get a sense of Comcast’s value I prefer to examine the following valuation methods.
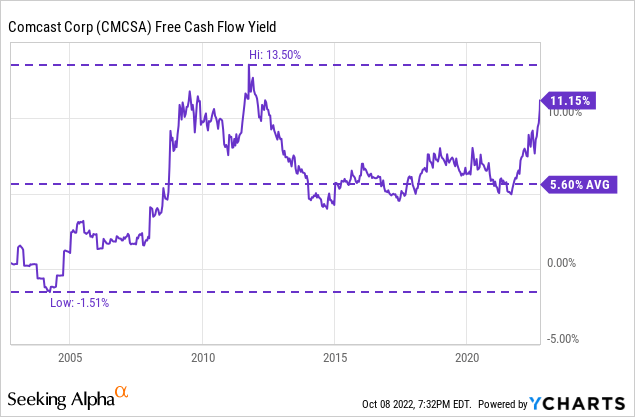
Free Cash Flow Yield
Cash flow matters. Comcast is currently yielding 11.24% in FCF. The last time it yielded this much was the period from 2008-2012 when FCF growth was averaging 23% per year. According to FAST Graphs analysts, FCF growth is expected to be flat into 2024. Past FCF growth has been 12.5% CAGR and the consensus long term estimate is 9% annually.
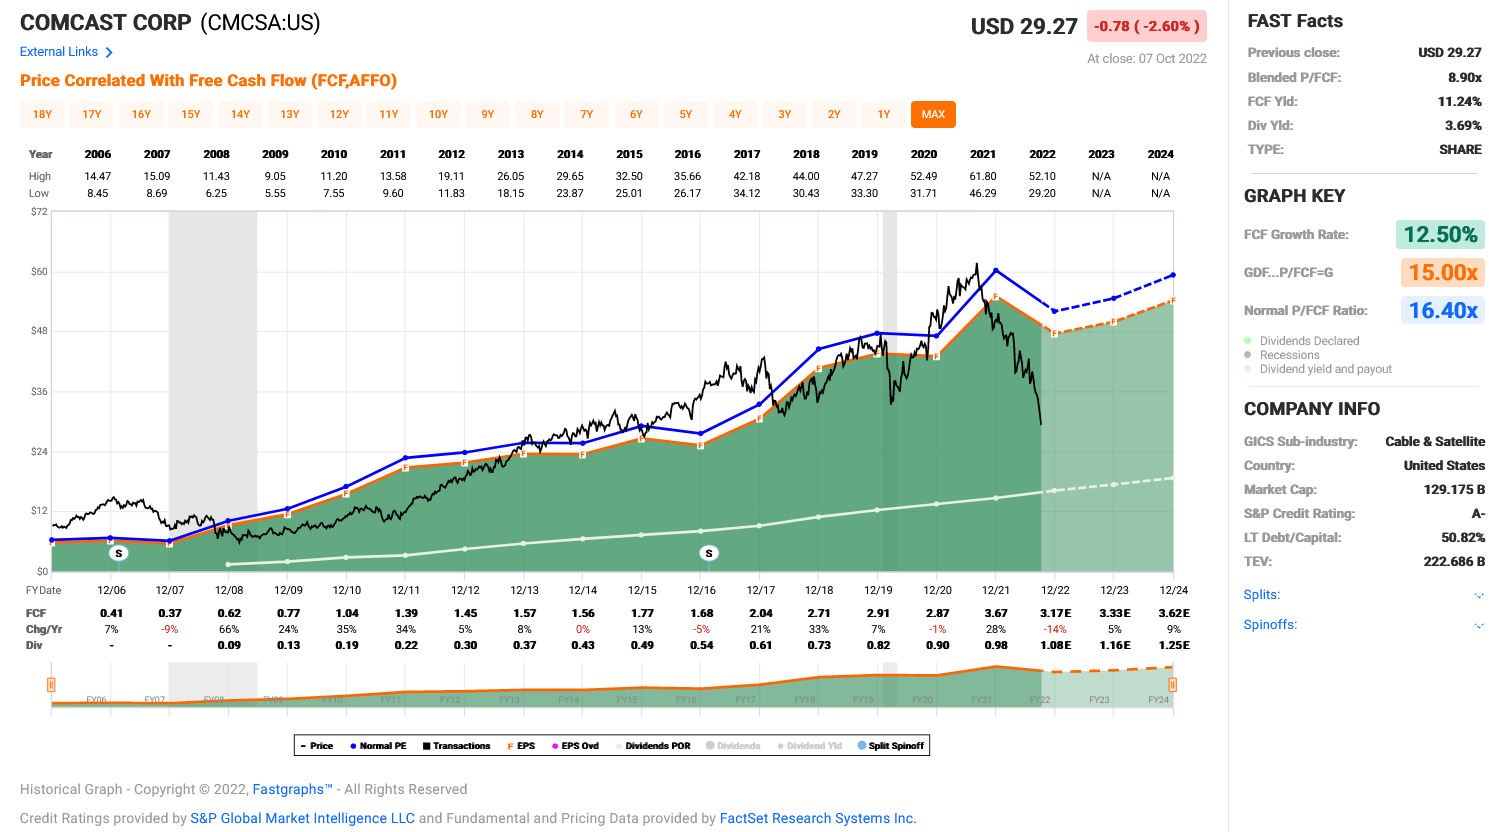
FAST Graphs
The average FCF yield over the past 2 decades was 5.6%; however, risk-free rates were considerably lower over that period of time.
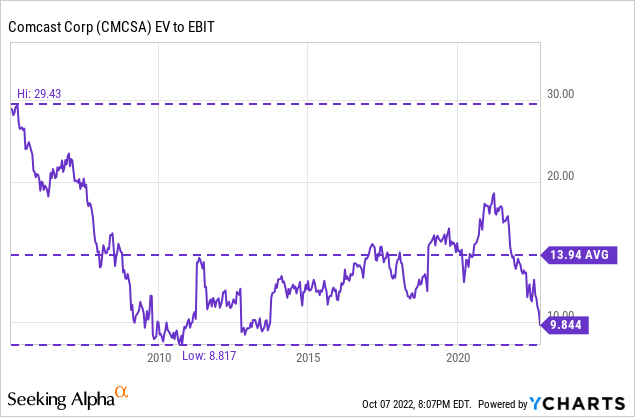
EV to EBIT
Due to CMCSA’s high debt to equity ratio I want to examine the enterprise value. The company’s EV to EBIT ratio is approaching lows last experienced in 2011. The steep decline in market capitalization has dropped the EV/EBIT from 19 less than two years ago to 9.844 today. This is well below the 17-year average of 13.94. Past EBIT growth has been 11.62% CAGR and the consensus long term estimate is 9% annually.
Price to Sales
Comcast’s price-to-sales ratio has reached lows that were last experienced in the depths of the 2008 recession. At a P/S of 1.1 the market has priced out high growth.
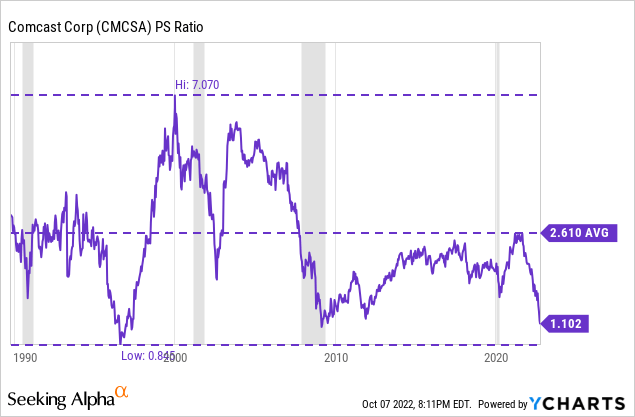
Comcast has a normal P/S of 2.05x. According to FAST Graphs analysts, sales growth is expected to be flat into 2024. Past sales growth has been 11.89% CAGR and the consensus long term estimate is 9% annually.
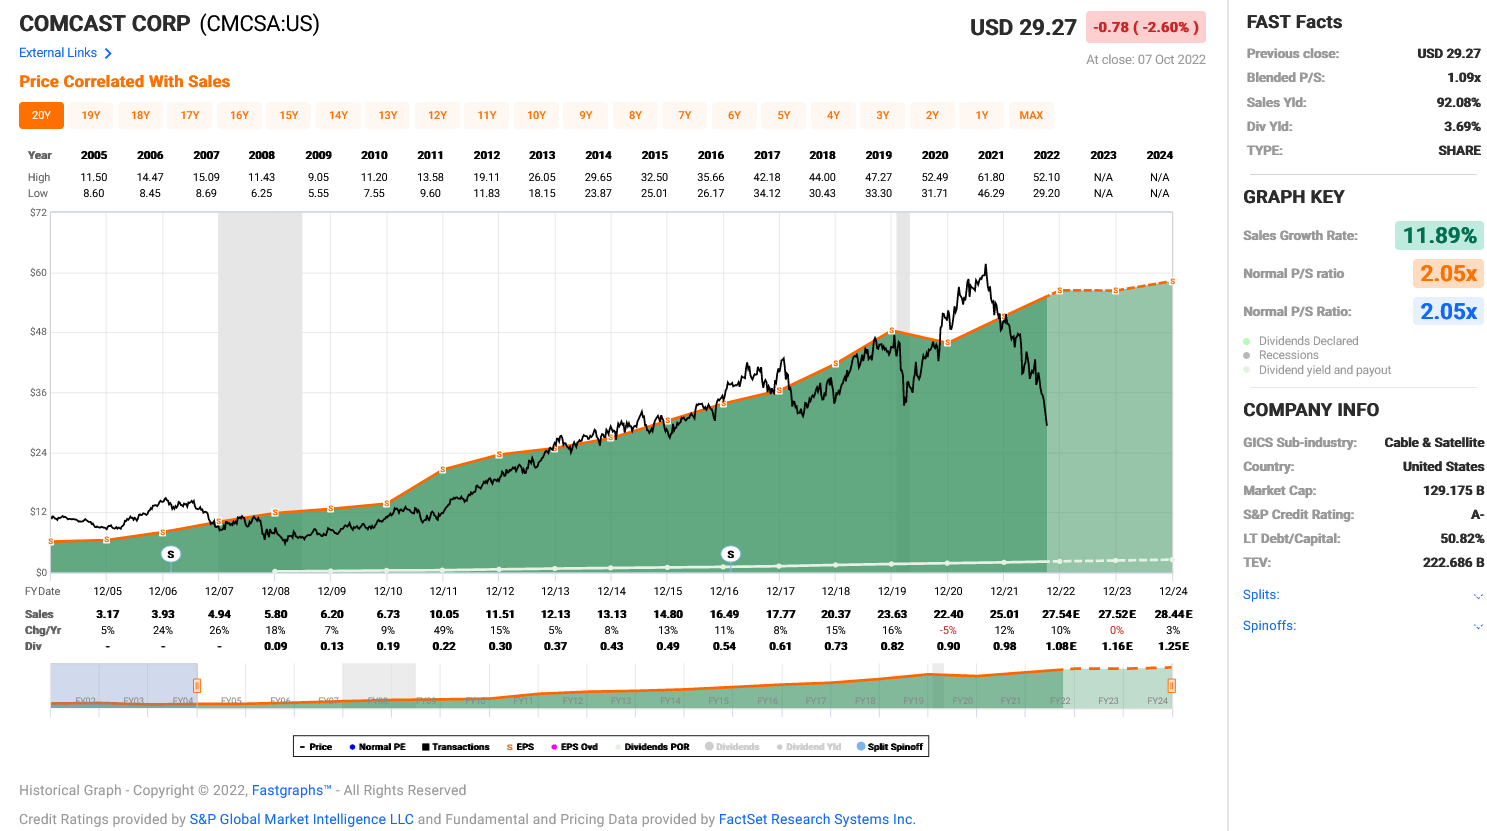
FAST Graphs
Price/Earnings-to-Growth
A PEG ratio of 0.66 and a forward PEG of 0.7 suggests that the market is pricing in weak growth. While GAAP PEG is higher than the sector median at 0.42 the forward non-GAAP is substantially better than the sector at 1.22. Even with generous growth estimates these valuations are not expensive.
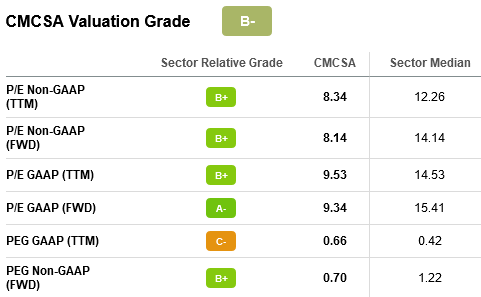
Seeking Alpha
Risk-Free Rates
I’ve discussed the topic of interest rates before. It is my expectation that the Federal Reserve will continue to raise rates for the next 1-2 quarters. I think there’s a high probability that the rate hikes end in 2023. Comcast will continue to be under pressure as rates rise. My base case is that the 2-year Treasury reaches 5%. Assuming a consistent risk premium spread this would imply a CMCSA share price of $27.92 with current earnings.
So, is Comcast Cheap?
Compared to historical growth? -Yes.
Compared to long-term growth expectations? -Yes.
Compared to current growth? -Yes, sort of.
Compared to risk-free rates? -Not really.
Compared to the current macro environment? -No.
The short-term outlook for CMCSA is poor when considering that risk-free rates are likely to continue higher and the U.S. consumer is struggling financially. It creates a scenario where neutral growth still results in punishment to share price.
But these conditions are temporary. Eventually rates will peak, risk premium will shrink, and growth will return. It is when fundamentals appear bleak that contrarian positions are the most successful.
Knife Catching PPE
Despite my expectation for lower share prices, positions in CMCSA today are positioned well for the long-term future. Therefore, I have decided to begin building a position in CMCSA. To mitigate additional downside I am employing two strategies:
- Dollar cost averaging
- Selling covered calls
I view this strategy like wearing gloves to catch this knife. In addition to buying shares on weakness I plan to strategically close the short call positions on weakness as a supplemental form of dollar-cost-averaging.
Below is an example of the covered call position that I have executed in CMCSA.
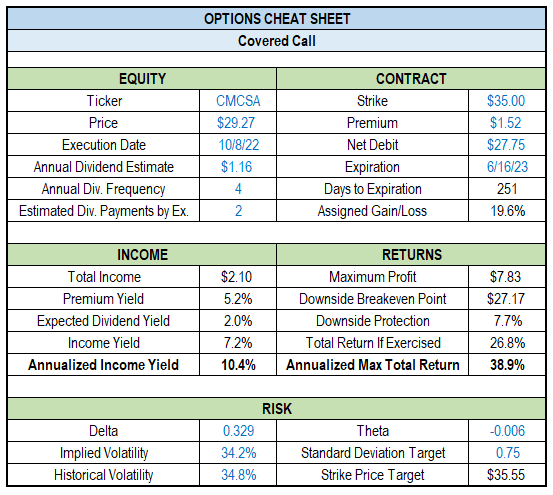
Image by author (data from TD Ameritrade)
Summary
Comcast has lost significant market cap over the past two years. This is disappointing because the company has continued to perform well to this point. In truth, shareholders are victims of higher risk-free rates. To make matters worse, the short-term outlook is deteriorating. Subscriber growth is slowing considerably and cable’s entire existence is under question.
Management is addressing these issues directly by investing in DOCSIS 4.0. Comcast will be among the first to deploy the technology in 2023. This will help shore up the broadband segment while other segments are demonstrating considerable growth.
In due time, these challenging conditions will pass. Growth will return and interest rates will peak. By acting as a contrarian now, investors of Comcast are setting up for a promising long-term future. Count me amongst them.
Editor’s Note: This article was submitted as part of Seeking Alpha’s best contrarian investment competition which runs through October 10. With cash prizes and a chance to chat with the CEO, this competition – open to all contributors – is not one you want to miss. Click here to find out more and submit your article today!