Investment Thesis
One example out of hundreds daily, this time using Saia, Inc. (SAIA) and J.B. Hunt Transport Services, Inc. (JBHT) tells where the information from their (and others) equities shopping list can (and has in the past) produce better odds for bigger capital gain profit income.
This typically makes the capital invested far more productive than by chasing dividends from equities. The wealth-builder rule should be:
Retirement Funding By Capital Gains RFBCG
Which are the industry’s most interesting competitors?
And how do they compare in terms of coming price-change risks and rewards prospects?
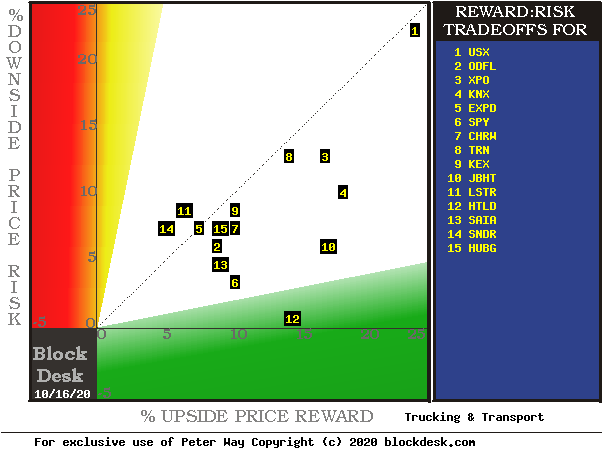
Figure 1
Source: Author
This map locates securities at the intersection of prospective price gains (green horizontal scale) and potential price drawdowns (red vertical scale) based on market-maker hedging behavior to protect their necessary endangerment of firm capital as they enable volume trades. Desirable conditions are down and to the right.
The stocks apparently of best advantage are along a “frontier” from S&P 500 Index Trust ETF (SPY) at [6] to HTLD at [12] to JBHT at [10]. We are also interested in SAIA at [13].
Alternatives to SAIA and JBHT are explored in greater detail in Figure 2, where other conditions contributing to reward and risk are contemplated. Principal questions for all alternatives are “how likely are these outcomes to happen”, and “can their impact be improved?”
Figure 2 presents the MMs’ price range forecasts for the best-ranked alternative investment candidates in Figure 1, along with the past 5 years of daily forecast outcomes from their prior forecasts with the same proportions of today’s up-to-down prospects.
This table presents data on the stocks most likely to produce satisfying RATES of capital gain under the portfolio management discipline known as TERMD, explained by article How To Better-Than-Double Your Capital Gains (From Stocks Alone) By Using TERMD Portfolio Discipline in my SA blog.
That discipline seeks the largest, most likely, quickest to be captured net capital gains with the least interim exposure to price drawdown on the way to target reward attainment.
Figure 2
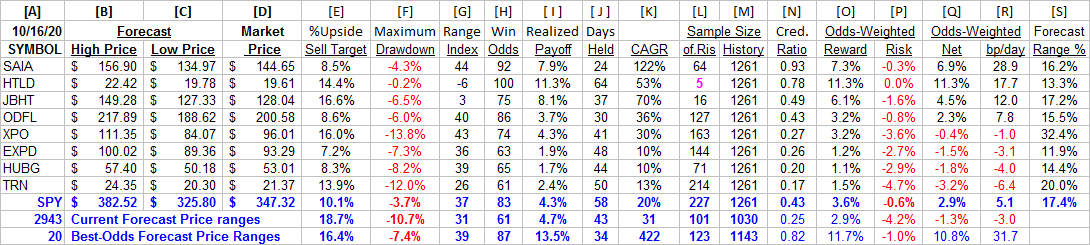
Source: Author
Contributing to that evaluation are the demonstrated odds of a profit-successful forecast in column [H], its complement of 100 – H, or loss frequency, size of net gain attained [ I ] and size of worst loss exposure [F] so that when appropriately odds-weighted in [O] and [P] they produce the Net of [Q]. Respecting the power of compounding, [Q] converted into basis points per day [J] of capital commitment at [R] presents a highly comparable figure of merit (fom) for investing preferences.
Figure 2 is row-ranked on [R]’s figure of merit (fom) and identifies JBHT’s capital gain prospects just below those of SAIA and HTLD. JBHT suffers in that comparison from its profitability record of “Win Odds” in [H] at 75 out of 100, compared to the others above 90 out of 100.
But HTLD suffers fatally from further consideration from lack of adequate evidence to support its “perfect” Win Odds of 100. Relevant experiences for all of Figure 2’s columns to the right of [E] are based on prior MM forecasts of the last 5 years Range Indexes [RI] like the ones now in [G]. For HTLD the sample of only 5 priors is too small to avoid the potential for its results to be the chance of a lucky week of low RIs which may not be repeated with the confidence suggested in [H].
This article is offered as a learning experience, so I will persist in the HTLD data as it compares to SAIA and JBHT. Column [N] of Figure 2 provides a “Credibility Ratio” of the average net gains achieved in the RI Sample [L] as shown in [I] compared to the current MM forecast’s upside price-change extreme given in [E]. An [N] value of 1.00 or greater should be a reassuring positive; less may be a more conservative reality.
While HTLD has only a small sample, its .78 [N] is better than JBHT’s experiences of less than half of its prior forecasts. SAIA’s .93 [N] is quite good, compared to everything else in the column. So its [E] forecast of only half of JBHT’s maybe should be taken as an about equal. But HTLD, unfortunately is, this time around, out of the game.
Put in terms more directly comparable with all equity investments for which we have comparable forecast inputs, SAIA’s fom [R] of 29 is very competitive today. It is far better than the market-index ETF SPY’s current weak 5.1 and its CAGR [K] of +20%.
Top-ranked 20 MM forecast alternatives out of the MM-forecast population of 2900+ have upside fom average prospects larger than all Trucking and Transport stock alternatives, and is well above the 27 bp/market-day needed to produce a capital investment double (100% CAGR) when sustained for year.
These top-ranked stocks get their strength from Win Odds of 87 – 7 out of 8 profitable outcomes – and high (.82) credibility of forecast gains, delivering +13.5% on average. On top of that, their holding periods required only 34 market days on average, less than 7 weeks, allowing 7 or more compounding opportunities a year. Which accounts for their over 400% CAGRs.
The overall population of 2900+ forecasts from which these 20 were combed today had a far less attractive average. Despite big forecasts of over +18%, they experienced nearly -11% price drawdown exposures on the way to their prior closeouts and loss experiences in nearly 40% of the outcomes. While this “market average” of forecasts showed a prior-forecast history of actual gains, when it is adjusted for its odds-weighted experiences it comes up with a small loss.
Recent trend of MM price range forecasts
A look at recent past tracks of MM-hedging derived price-range forecasts may help in how thoughtful investors could come to different preferences between SAIA and JBHT in choosing to commit part of a wealth-building portfolio’s capital for the next few months.
Figure 3
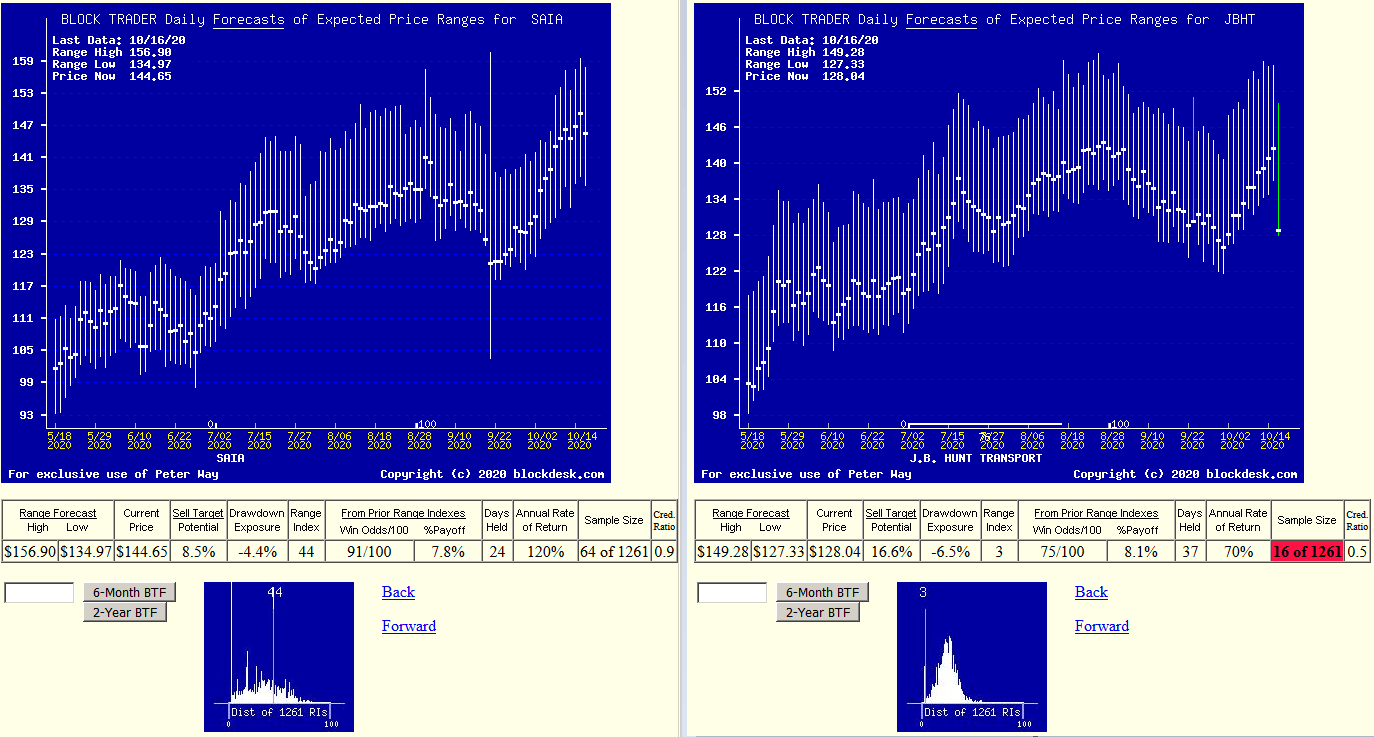
(used with permission)
Figure 3 pictures separately the past 6 months of SAIA and JBHT daily MM implied price range forecasts, side by side. The vertical bars plot the price ranges, with a heavy dot at the market’s quote on the date of each forecast. That splits the range into upside and downside coming price change prospects in a visualization of the Range Index calculations.
The small pictures at the bottom of each stock’s forecast trend are frequency distributions of its Range Index calculation during the past 5 years of 1261 daily forecasts. The more neatly organized distribution for JBHT suggests that stock has a better developed appraisal of coming values of the two.
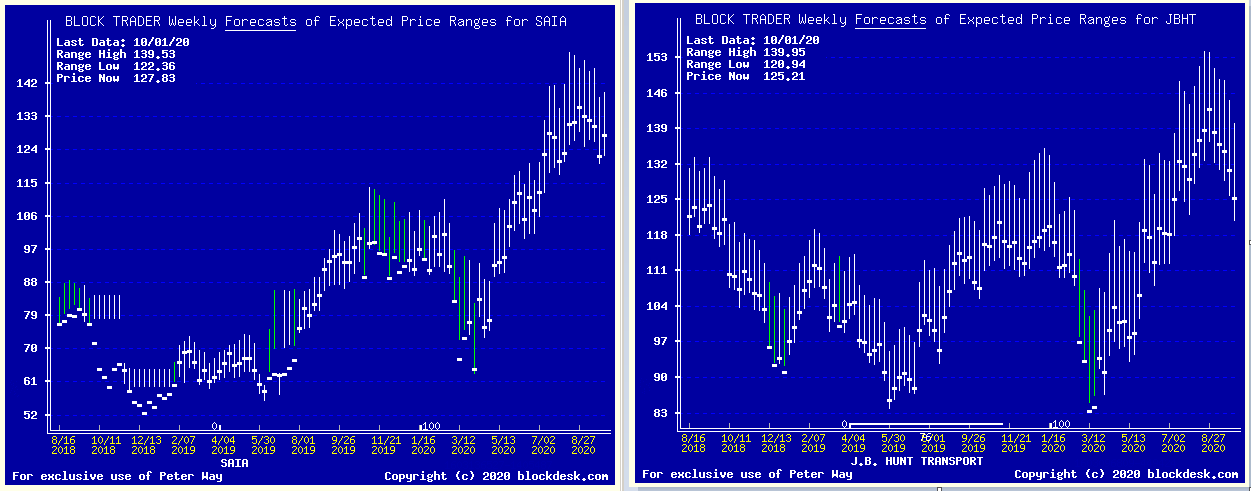
A look at Figure 4, which is the same two stocks’ MM forecasts, but on a weekly frequency over 2 years instead of 6 months days, tends to support that conclusion.
Figure 4
Still, when the Figure 2 table of data is consulted the Win Odds and Cred.Ratio for SAIA tend to offset JBHT’s larger upside MM forecast and more orderly RI history. My personal preferences tend to be more influenced by the shorter holding period experiences of SAIA, under 5 weeks of market days, with JBHT positions taking half again as long, 7 ½ weeks.
SAIA’s RI of 44 is nearly mid-range, while JBHT at 3 is near the lowest forecast price. To reach a similar Realized Payoff of 8% it may reasonably take longer to reach its top of the 17+% forecast range than SAIA needs to reach its top, up only half of the similar-size range.
Time is precious – and powerful when compounding retirement returns. Frequency counts mathematically in power functions like compounding. That is why SAIA’s fom of 28.9 basis points per day produces a CAGR of 122%, compared to JBHT’s prospect of only +12.0 and CAGR of +70%.
But not all investors are identically motivated by the pressure of inadequate time to meet financial objectives. So it may be less distressing to choose the less rapid path to similar payoffs.
Conclusion
Saia, Inc. provides a high-probability, credible, rapid prospect of capital gain for the investor in need of an assured (not guaranteed) wealth-building portfolio buy.
Disclosure: I/we have no positions in any stocks mentioned, but may initiate a long position in SAIA over the next 72 hours. I wrote this article myself, and it expresses my own opinions. I am not receiving compensation for it (other than from Seeking Alpha). I have no business relationship with any company whose stock is mentioned in this article.
Additional disclosure: Disclaimer: Peter Way and generations of the Way Family are long-term providers of perspective information, earlier helping professional investors and now individual investors, discriminate between wealth-building opportunities in individual stocks and ETFs. We do not manage money for others outside of the family but do provide pro bono consulting for a limited number of not-for-profit organizations.
We firmly believe investors need to maintain skin in their game by actively initiating commitment choices of capital and time investments in their personal portfolios. So, our information presents for D-I-Y investor guidance what the arguably best-informed professional investors are thinking. Their insights, revealed through their own self-protective hedging actions, tell what they believe is most likely to happen to the prices of specific issues in coming weeks and months. Evidences of how such prior forecasts have worked out are routinely provided in the SA blog of my name. First months of 2020 to date have produced over 4100 profitable position closeouts in a 76%/24% win-loss ratio.