
Fidelity National (FNF) is unquestionably undervalued both on a relative and intrinsic basis. With the booming housing market as a headwind, the company is headed for a long runway of growth.
The company also completed its acquisition of F&G during the quarter, and a snippet of its performance added to the second quarter’s performance.
Along with the growth from a market-leading position in title insurance, the company also supports a growing dividend that yields 4.21%.
Let’s dive in and take a look, shall we?
Overview
Fidelity National reported its second-quarter earnings ending June 30, 2020. The company specializes in real estate insurance, focusing on title insurance, escrow, and other title-related services.
Founded in 1847 and based out of Jacksonville, FL, the company currently has a market cap of $9.42B and has a market price of $31.46.
Some highlights from the second quarter:
- Total revenue of approximately $2.4 million and an increase of 12.5 over the comparable quarter of 2019.
- Second-quarter earnings of $304 million and adjusted earnings of $305 million compared to the earnings of $266 million and adjusted earnings of $255 million in 2019.
- Diluted second-quarter EPS of $1.09 and diluted adjusted EPS of $1.09 compared to diluted EPS of $0.96 and adjusted EPS of $0.92 for 2019.
- Completion of the FGL Holdings acquisition with the results folded into Fidelity National’s financials for one month ending the second quarter.
A little more detail on the quarterly performance of Fidelity National, as the company breaks up its operations into three segments:
- Title
- F&G
- Corporate and other
Title
Let’s take a look at the operations of the title segment first.
The title segment had revenues of $$2,224 million, which was a 6% increase over the comparable quarter of 2019. Correspondingly, the segment’s earnings increased by 26%, for a total of $528 million.
Title premiums decreased by 1% at quarter’s end. The decreases stemmed from a decrease in title premiums from direct operations of $50 or 8%, offset by an increase in title premiums from agency operations of $30 or 4%.
Our adjusted pre-tax title margin was 18.4%, a 70 basis point increase over the prior year. We had a 36% increase in direct orders closed, driven by a 158% increase in daily refinancing orders closed, offset by a 24% decrease in daily purchase orders closed and a 24% decrease in total commercial orders closed.”
The company reported total commercial revenues of $184 million, down 36% compared to the second quarter of 2019. The decline was driven by a 24% decline in closed orders and a 14% decline in total commercial fees per file. Also, commercial orders opened declined 25% compared to the previous year.
Overall, for the second quarter of 2020, the average fee per file was $1,889, a 25% decrease compared to 2019.
F&G
The F&G acquisition was closed June 1, 2020, which provides the company with another revenue stream, away from the title premiums that are the companies bread and butter.
The segment focuses on principal life and annuity products for its customers.
The segment included reporting one month’s worth of financials that were in Fidelity National’s quarterly results. Overall, the segment saw $124 million in revenues, comprising $20 million in life insurance premiums and $111 million in interest and investment income. All of which was offset by $7 million in realized losses from investments.
The F&G segment for the quarter reported a net loss of $44 million from continuing operations.
Breaking that down a little more, the largest impact on earnings was the changes to the benefits and other policy changes, largely from the change in non-performance spread, which increased the FIA (fixed income annuity) derivative liability to $61 million.
Overall, the benefits and changes in policy reserves came in at $155 million, contributing to the month’s segment losses.
Corporate and Other
The corporate and other make up the parent company’s operations, various real estate brokerages, and the real estate tech subsidiaries.
The revenues for the segment improved to $72 million, an increase of approximately 38%. Unfortunately, the gains in revenues were offset by costs that produced a loss for the segment of $69 million for the quarter.
Personnel costs increased $26 million or 81% for the quarter due to increased valuations to the deferred compensation plan assets, offset by a lower headcount resulting from layoffs stemming from Covid-19 impacts.
Other operating expenses for the segment grew $24 million or 67%, as a direct result of the costs associated with the F&G acquisition.
With that, we wrap up our quarterly discussion; let’s look at the avenues of growth for Fidelity National.
Growth Story
Let’s look at what drives the bulk of Fidelity’s income, the title segment.
Fidelity National’s revenues come from the processing of both residential and real estate transactions and refinancing. The bulk of the revenues are highly correlated to both segments and those transactions.
Fidelity National’s revenues are highly dependent on the strength of the U.S. real estate market. Obviously, Fidelity National has positioned itself to prosper not only when the market is booming but when things are not so good.
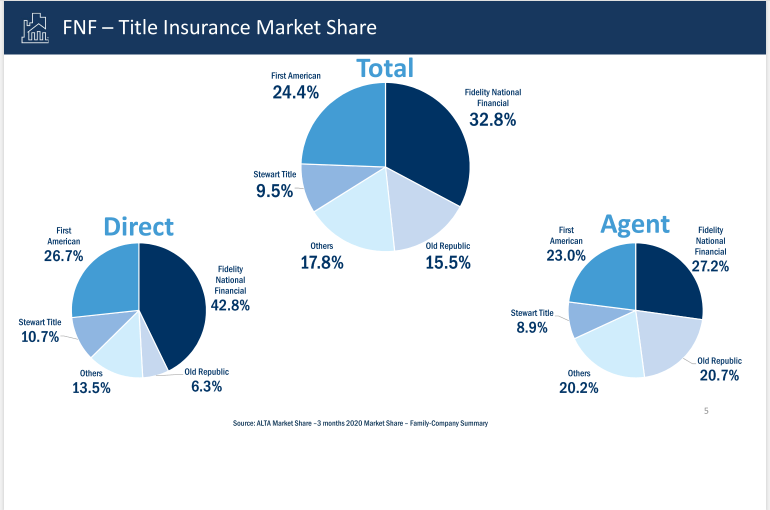
Chart courtesy of Fidelity National Financial Summer 2020 Presentation
As we can see from the above charts, Fidelity National commands a nice market share on a total basis at 32.8%. On an agent and direct basis, they have a better market share at 27.2% and 42.8%, respectively.
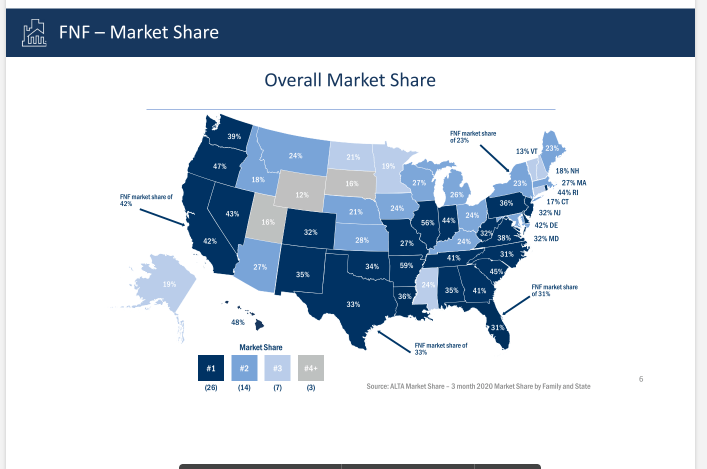
Chart courtesy of Fidelity National Financial Summer 2020 Presentation
Moving to a state by state basis, we can see the breakdown by state, and in many of the larger populated states, the company holds a number one position in market share, for example:
- California – 42%
- Illinois – 56%
- Texas – 33%
And looking a little deeper, we see that the company has a market position of number one or two in 40 states, and of the states, they are in the fourth position are some of the lower populated states of:
- South Dakota
- Wyoming
- Utah
If we combine those market share numbers with the growing housing starts and existing home sales, both numbers are growing since the coronavirus quarter and continuing the trend that had begun last year.
All evidenced by the below graphs from the FRED, which helps outline that idea.
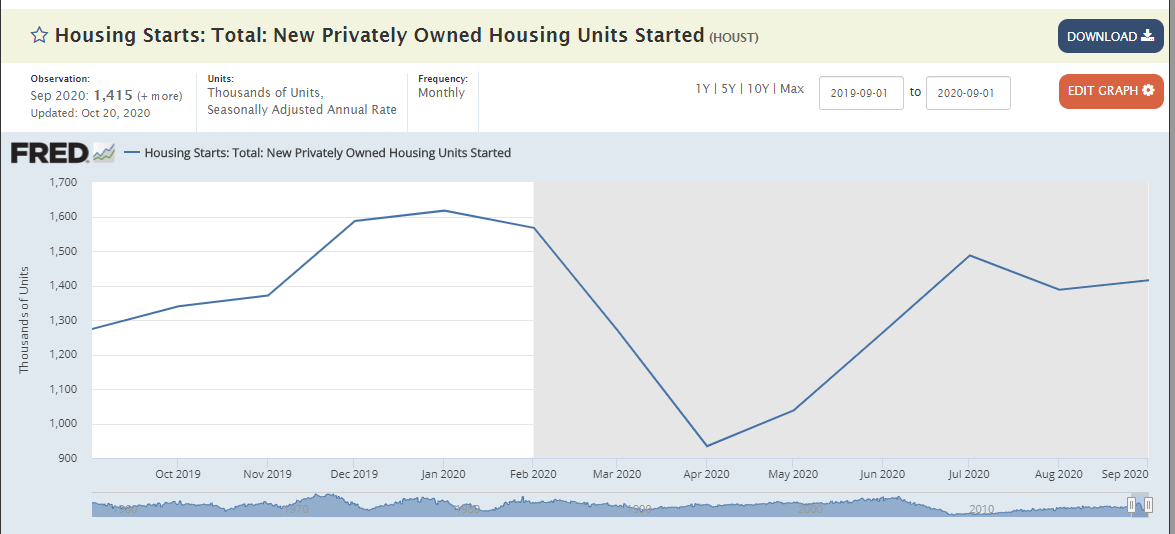
Chart courtesy of FRED St. Louis
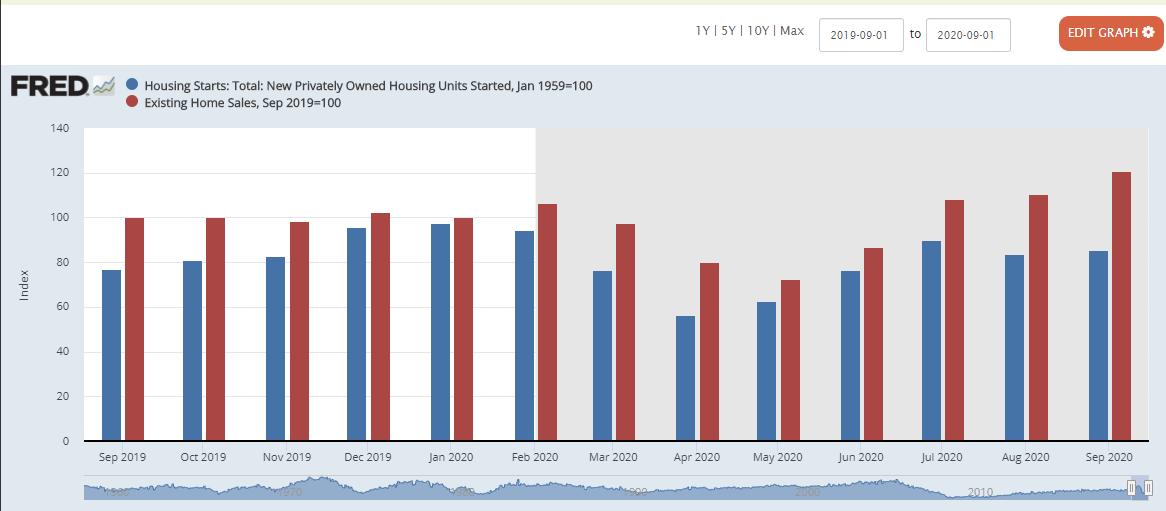
Chart courtesy of FRED St. Louis
The housing market has seen big growth over the last few months, driven partly by the stir craziness that was induced by the pandemic. The Fed undertook in early March also by reducing interest rates, lowering the rates to near zero.
That decrease in rates likely spurred the increase in new home sales, housing starts, and existing home sales. And initially, in the pandemic, the refi opportunities were elevated because of the low rates, but recently rates have crept back up, lowering that demand.
All of this bodes well for the company as the primary option for title insurance for these transactions, driving its increasing revenues and profitability.
With the continuing demand for new homes and existing home sales, the company should enjoy a long runway of growth. As the economy starts to bounce back and people get in a better position, the trend will continue at least into 2021. That is purely speculation on my part, but I believe it is more than a likely scenario.
The next big news for the quarter was closing the F&G acquisition, with the company’s financials folded into the quarter’s results based on June.
Fidelity National expects the merger to add 10% increases to the earnings for 2020 and 20% for 2021.
If you want a more complete outlook and analysis of that merger and the opportunities it presents, please check out the fantastic article by my fellow SA contributor, Cubento Capital
The article lays out the ideas and benefits from the merger far better than I could hope to replicate.
The profitability of the company rebounded, with the net margin returning to pre-Covid-19 levels at 12.77%. In the previous quarter, the Corona quarter’s beginnings slipped to (3.78)%, which impacted the bottom line and the earnings, and we all know how much Wall Street hates that!
The last five quarters of net income %, per Gurufocus:
- June 2019 – 12.41%
- Sept 2019 – 11.16%
- Dec 2019 – 14.39%
- Mar 2020 – (3.78)%
- June 2020 – 12.77%
The above illustrates the company’s ongoing profitability and management’s ability to control costs as they go through a difficult period. Also, illustrated by the unfortunate laying off of 3100 employees in March, they have been able to rehire approximately 1100 employees in June and July.
Also highlighting the profitability of the company is the fantastic return on equity for the quarter of 14.72%, which was an 82.29% increase compared to the sector median of 8.07%.
The quarterly ROE was also an increase of 18.13% compared to their five-year average of 12.46%.
By the way, Seeking Alpha grades Fidelity National a B+ for its profitability.
Lastly, the dividend, which at an annual payout of $1.32, which yields a 4.21% bonus, is another bonus for investing in this company. The dividend is also safe with a 32.77% payout ratio, with growth on a five-year basis of 25.98%. Again Seeking Alpha rates the dividend:
- Safety – B-
- Growth – A
- Yield – B
- Consistency – B
Based on the growth in the housing market and the likelihood that continues now and into at least the remainder of 2021, the outlook for Fidelity National bodes well, plus we have a 4.21% yielding dividend to pile onto any growth we see from the price appreciation.
Risks
One of the risks listed in the latest quarterly report is the growing aging population that increases risks of lower home purchases and refi opportunities.
Per the 10-q, over 10,000 people will turn 65 each day over the next 15 years, and according to the U.S. Census Bureau, the population over 65, expected to grow 15% to 20% from 2015 to 2030.
Over time, that decrease in customers may erode the company’s growth of new home buyers and attack their primary revenue source.
Another risk the company faces is in the arena of interest rates, possibly growing in the future. The Fed has stated numerous times it believes it will keep rates for as long as needed, but it also wants to stimulate some inflation at some point.
If rates rise, that would jeopardize the housing market’s growing demand for new homes and existing sales. All of which could eat into the revenue growth for the company.
Keeping an eye on those rates will be key for any investor, especially any insurance business, along with the impacts ongoing to the new acquisition, F&G.
Valuation
Next, let’s take a look at the valuation of Fidelity National, my favorite part.
I want to look at the company on a relative basis and an intrinsic basis to do this.
Relative basis first, the company’s TTM GAAP P/E of 10.77, which Seeking Alpha grades a B-, is 7.53% below the sector median of 12.39, and 31.86% below its five-year average of 15.755.
If the company grows into the 7.53% sector, at the current market price of $31.37, it would yield a market price of approximately $33.73. If the company grew into its historical average of 31.86%, it would yield a market price of $41.36.
Both comparisons give us a range of approximately between $34 and $42, which tells us that the company on either comparison is undervalued.
Moving on to the intrinsic valuation, let’s take a look using both a dividend discount model, a little old school, and an excess returns model.
Looking at the dividend discount model first, assuming these inputs into the model:
- Required rate of return – 8.78%
- Based on the following values:
- Beta – 1.37
- Risk-free rate – 0.85%
- Equity risk premium – 5.79%
- Based on the following values:
- Dividend payout ratio – 54%
- Retention ratio – 46%
- Current annual dividend – $1.63
- 10-year median Return on Equity – 10.60%
Plugging all those inputs into the model yields a market price of $43.75, which has a margin of safety of 25.80% compared to the current market price.
Next, looking at the excess return model and plugging in the following inputs:
- Cost of equity – 8.78%
- Return on equity – 15.62%
- Basing the ratio on the TTM net income and shareholders’ equity
- Dividend payout ratio – 54.15%
- Current annual dividend – $1.63
I include the charts from the model to follow along at home; the model adjusts both the cost of equity and returns on equity over the ten years.
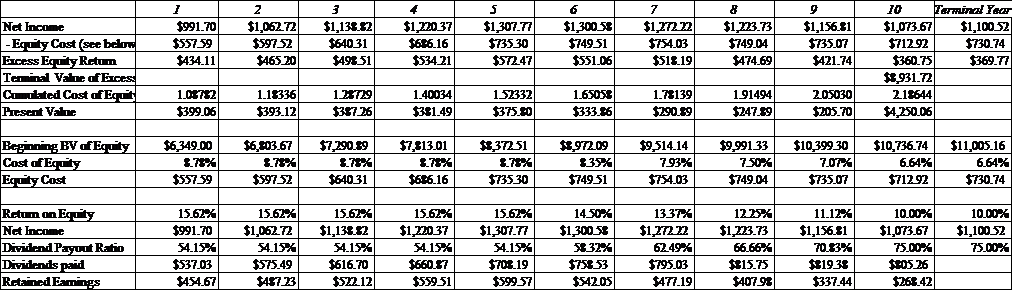
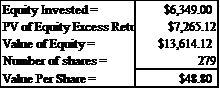
The model spits out a value of $48.80 based on all the inputs, which gives us a margin of 35.7% safety if any of my assumptions are incorrect.
Pulling all the ideas together, we get:
- P/E Comparison – a range of $34 to $42
- Dividend discount model – $43.75
- Excess return model – $48.80
All that gives us an approximate range of $34 of $49, which tells me that the company is undervalued, and I agree with all the methods. I think a price range of $42 to $49 is appropriate for both its earnings and profitability.
Final Thoughts
I will not lie; I am ecstatic that I stumbled across this company as I think it is a gold mine. The metrics all look great; the management seems like they understand the business and have done a great job navigating a tough time in our history.
Based on the above ideas, plus the undervaluation on any basis, the company is a buy-in my book at these prices, even until the mid-40s.
I have sold out of another position to start a long position with Fidelity National.
Disclosure: I am/we are long FNF. I wrote this article myself, and it expresses my own opinions. I am not receiving compensation for it (other than from Seeking Alpha). I have no business relationship with any company whose stock is mentioned in this article.