Investment Thesis
Zoom (NASDAQ:ZM) was one of the best performing stocks during 2020. It grew around 430% and then managed to lose it all. However, the company’s execution has been diametrically opposed to its recent stock performance. The company grew its net margin from 4% to 36% and sits now on a pile of around $1.5 billion in free cash flow. So, let’s see what makes investors (myself included) not buy the stock of this great performing company.
KPIs
Besides the high NPS score (in September 2021 Zoom revealed a NPS score of 70+, which is great), good revenue visibility or high % of insider ownership (20%), I’m trying to focus on some operational KPIs that can paint a good picture for the company for both present and future growth prospects. We know that 67% of Zoom’s revenue comes from US at the end of 2021, so I’m trying to see if there are any signs that the US video-conferencing market might be exhausted.
Customers growth
Source: Zoom 10-K FY22
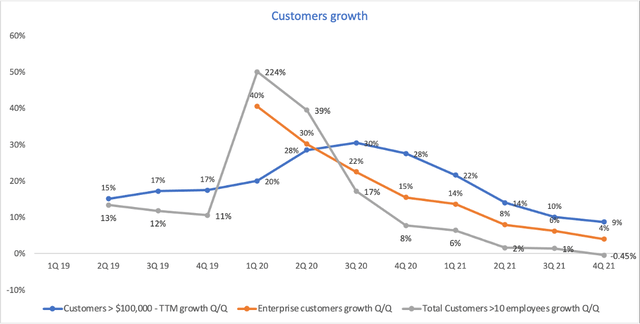
Customers > 10 employees decreased for the first time at the end of 2021 compared to Q3 2021. The company doesn’t disclose a churn rate, but instead it chose to focus on the Enterprise customers (customers that have been engaged by Zoom’s direct sales team). This category grew modestly in the last quarters, coming in with only a 4% growth quarter over quarter. After the huge pull-forward following the pandemic, Zoom made clear that it will allocate most of its resources on the enterprise segment, which is expected to become an increasingly higher percentage of total revenue over time.
Net Dollar Expansion Rate
The TTM Net Dollar expansion Rate is a measure that shows how much more does a customer spends on the Zoom platform as compared to 12 months ago. It includes any upsell or expansion from a customer. Zoom just started reporting this metric for both Enterprise and > 10 employees customers, as in the past it would provide only one value for its Net Dollar Expansion Rate.
Net dollar expansion rate = Current Annual recurring revenue (ARR) / Annual recurring revenue (ARR) from 12 months ago
For its Enterprise customers, the Net dollar expansion rate has been consistently bigger than 130%. In its last quarter it was sitting at 130%, which is a great value for a software company.
For the > 10 employees customers, it recorded a 129% value, after being higher than 130% for 14 consecutive quarters. This metric showcases that the company monetizes very well its existing customers.
Remaining Performance Obligation (RPO)
Source: Zoom 10-K FY22
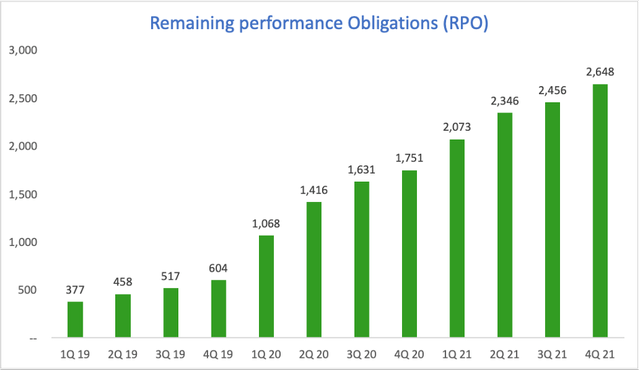
Remaining performance Obligations (RPO) consists of both billed considerations and unbilled amounts that Zoom expects to recognize as revenue. RPO shows how much Zoom’s customers have committed to spend on the platform.
RPO = deferred revenue (billed, unearned revenue) + backlog (future performance obligations that haven’t been invoiced)
I believe the RPO will begin to decrease soon, unless the company can upsell its adjacent products at a faster pace than it did so far.
Customer Acquisition Cost (CAC)
This metric is very important and shows how well the company is using its sales & marketing team. It’s important to analyze sales efficiency to ensure that growth is efficient and sustainable.
CAC = S&M Expenses period n-1 / Nr of new customers in the current period
Source: Zoom 10-K FY22
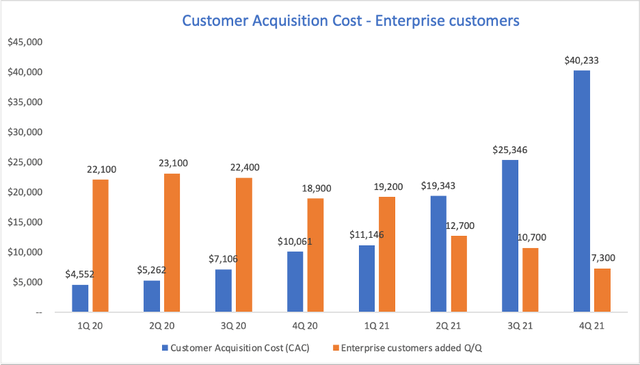
Unfortunately for Zoom, for its Enterprise clients (customers that have been engaged by Zoom’s direct sales team) the CAC went through the roof. As we can see, less and less customers have been added in 2021 on a Quarter/Quarter basis while the S&M expenses have growth consistently.
As a result, the CAC is very high and it seems like Zoom has temporary difficulties into obtaining new customers. As a consequence, the lifetime value for the new customers is very low and it is generally lower than the cost of obtaining a new customer.
CAC Payback Period
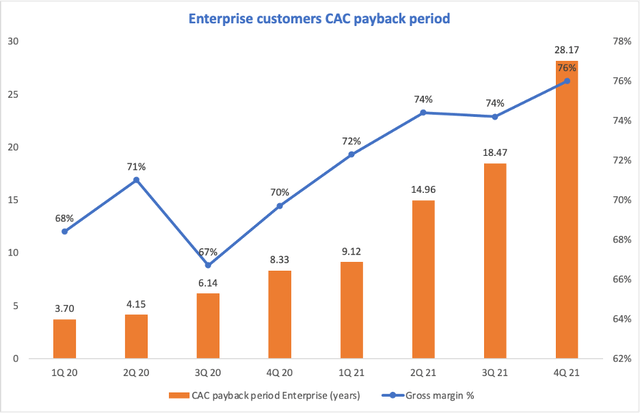
This shows how many years it takes on average for a customer to produce enough gross profit to pay back its CAC.
CAC payback period = Average S&M Expense per customer / Average revenue per customer x Gross margin
Source: Zoom 10-K FY22
As a consequence of the increase in the customer acquisition cost, the CAC payback period has seen a tremendous increase. This means it would take an average enterprise customer around 28 years to generate enough gross profit to compensate for the cost of acquiring the customer. The trend is definitely deteriorating and since there are only 2 variables included, CAC and Gross margin, even if the latter improved, the CAC growth outweighed the gross margin improvements. Moreover, the S&M spent in Q4 2021 is not included here, although it continues to grow and did so with 52% as compared to Q4 2020.
Rule of 40
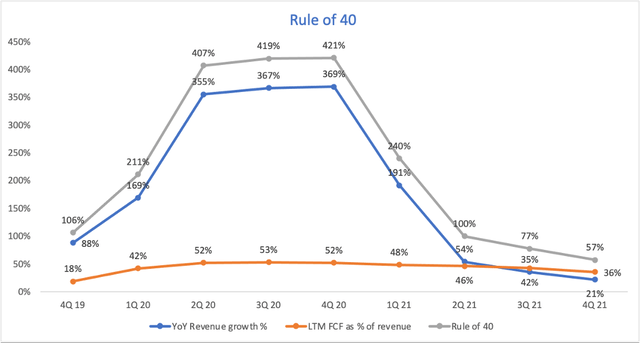
Source: Zoom 10-K FY22
Rule of 40 is another crucial metric for the health of any software business. It takes into consideration two important operating metrics: YoY revenue growth % and Free cash flow as % of revenue for the last 12 months.
The company has consistently maintained a high free cash flow % as compared to the revenue. If before the pandemic the free cash flow was only around 18%, now it sits around 36%. This has been a great aspect for Zoom in the last two years as the company managed to transform more of its revenue into free cash flow.
As a conclusion, the rule of 40 remains a plus for Zoom since the company has a result of 57% in Q4 of 2021, but it needs to be followed closely in the subsequent periods.
To summarize the KPIs section, the sales efficiency metrics have deteriorated and the momentum gained in 2020 has definitely slowed down. Zoom is now in a position where it is forced to upsell its new offerings to existing customers. That will translate to a high NRR, so watch for this metric in order to see how the company does.
Is Zoom’s management allocating capital well?
One metric that can help paint a picture is the Return on Invested capital (ROIC):
ROIC = Net operating profit after tax (NOPAT) / Average Invested Capital which also translates into:
ROIC = EBIT (1-tax rate) / Total Assets – Short-term liabilities (non-interest bearing)
The reason why we calculate the return on invested capital is to compare it with the cost of capital (WACC). If a company has ROIC > WACC, the company creates value for its shareholders. This principle is also explained by Warren Buffet in the 1$ test. Going further down a level, ROIC can be also expressed as a function of:
ROIC = NOPAT / Sales x Sales / Invested capital
What this analysis does is it tells us if the company has increased its net operating profit margin or if the return is better just because the company sold more units per 1$ invested (bigger sales turnover). Here’s how ROIC looks like for Zoom:

Source: Zoom 10-K FY22
For the above calculation I used 2 assumptions: The tax rate I used is 17.2%, which is the highest tax rate Zoom paid in any quarter. Zoom holds a lot of cash on its balance sheet. I did not remove the excess cash when I calculated the Invested Capital.
ROIC grew exponentially starting with 2020. This came as a result of both a better profit per sale (higher Nopat/Sales ratio) as well as a high number of sales for the same 1$ of invested capital. If we’re going to analyze the trend of the two in conjunction, we can see that most recently the operating profit margin has increased drastically while the contribution of the sales turnover has decreased.
To summarize, the low NOPAT margin from 2019 is explained by the growth nature of Zoom and the company has improved its NOPAT margin immensely during the last two years. This translated into a significant return on invested capital, much bigger than an average cost of capital for a SaaS business (usually lower than 10%). Zoom has captured successfully the tailwind that the COVID-19 pandemic created in its industry.
Upselling – the best way to grow?
For now, Zoom’s revenue comes mostly from Zoom Meetings. I think the penetration level for the additional products (only considering customers with more than 10 employees) is very low and Zoom might be struggling to upsell to its customers:
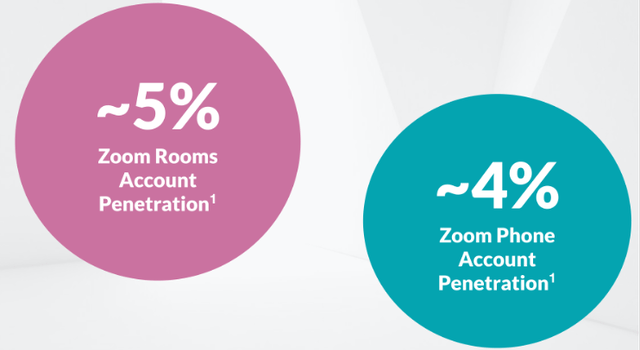
Source: Zoom Analyst Day FY22
On the flip side, since there are many existing customers, Zoom doesn’t have to spend money to attract new ones. They only need to gradually attract the customers to their platform while offering new adjacent products.
“We are going to target those customers who really want to standardize on Zoom platform, probably start from Meeting. And for those customers who deploy both Meeting and Phone, now they look at the Contact Center.” – Zoom CEO, February 2022
Zoom has surpassed the 2 million paid seats mark for Zoom Phone in September 2021 and has over 2.5 million paid seats at the end of January 2022. The company launched the service in January 2019 and in just two and a half years it has been able to become a significant player in the space. Most of the seats came from customers that are already using the Zoom Meetings, so upselling was crucial during this time:
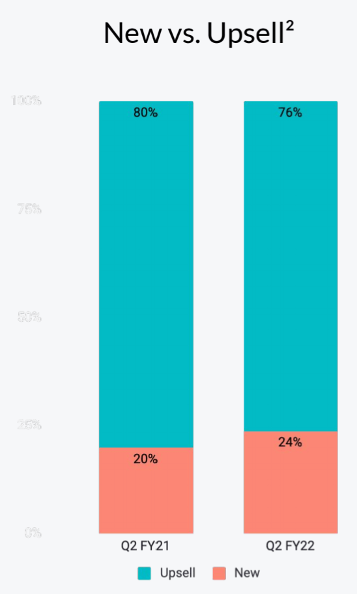
Source: Zoom Analyst Day FY22
Industry Fundamentals
A study published by Gartner in October 2021 puts Zoom in the “Leaders” category alongside Cisco and Microsoft for the video-conferencing space. When looking at an industry, I prefer to focus on three things that will tell me how easy can the company maintain market share:
Barriers to entry – With the recent technologic advancements, the service became very affordable, as we’ve seen entry prices as low as $4/license for a month of usage (Microsoft’s newest offering that takes aim at Zoom’s <10 employees customer base – which represents 33% of Zoom’s revenue). As a result, the barriers to entry are low.
Switching costs – The video conferencing solutions are only sticky from a contractual stance. The contracts for enterprises are usually signed for long-term periods and it might be difficult to convince customers to switch. However, the apps are now very intuitive and it is very easy to switch providers as it doesn’t require any training for the employees, which makes switching costs very low.
Pricing power – This is a tricky one. Zoom has proved that cost isn’t necessarily the most important criteria for businesses when choosing a video service provider. As most of the companies are already using the Microsoft Office suite (Statista estimates around 48% of the office productivity market is owned by Microsoft Office), I am honestly surprised that Microsoft Teams doesn’t dominate this space. But Zoom’s user interface and ease of using are two things that made the company gain market share and it looks like the company has some pricing power.
Financial Overview
Revenue & operating margins
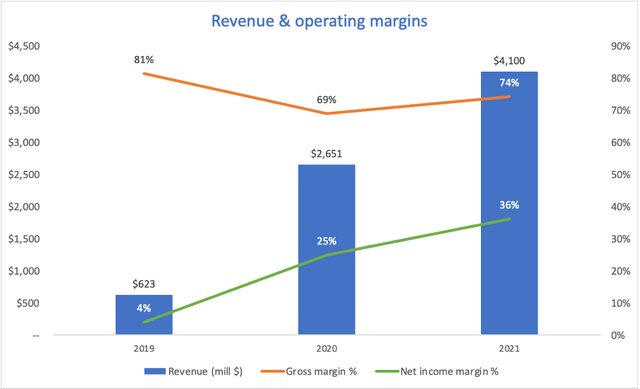
Source: Zoom 10-K FY22
Revenue grew tremendously for Zoom, as a result of the COVID-19 pandemic. As we can see above, the company has been completely transformed starting with the first quarter of 2020. Although the revenue grew strongly, the gross margin seriously deteriorated and dropped from 81% to only 69% in 2020.
Even if the gross margin decreased while the business grew, Zoom has managed to limit its operating expenses and the company grew its top-line much faster than operational expenses:

Source: Zoom 10-K FY22
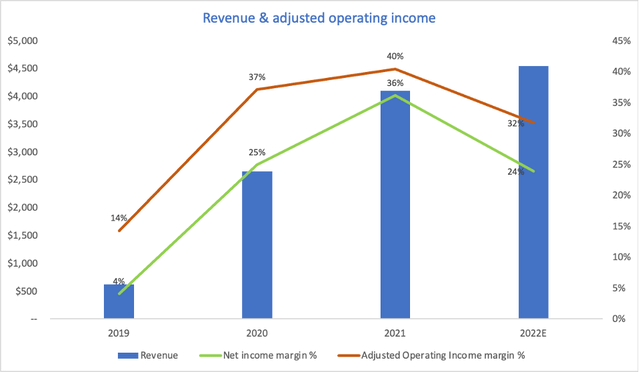
Zoom was already net profitable before Covid hit, with a net margin around 4%. The decrease of operating expenses as % of revenue, in conjunction with the pull-forward from the pandemic helped the company improve its net margin, sitting around 36% in 2021.
This is net profit to the shareholders and the metric is indeed extraordinary. It almost begs the question if the company is investing enough in its future growth. I personally would like the net margin to remain around 25% and for Zoom to keep investing the capital in order to generate better returns in the subsequent financial years.
Free cash flow (Cash from operations – Capital expenditures)
Source: Zoom 10-K FY22
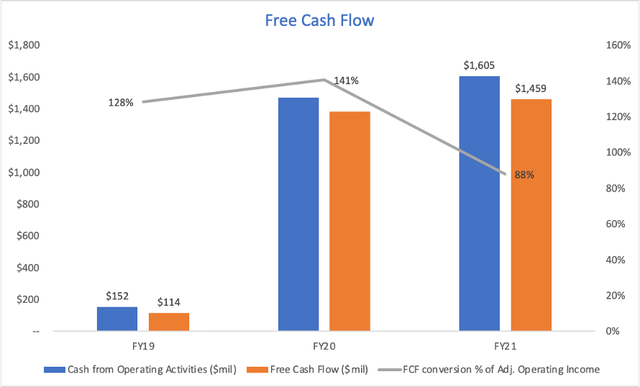
Zoom showcases a great trend in terms of Free cash flow. The company generated free cash flow before 2020, but starting with 2020 it had seen a tremendous improvement. At the end of 2021, the company had almost $1.5 billion in free cash flow for FY2021.
It represented 88% of the adjusted operation income (operating income including only operating activity), which is a very good sign for any company.
As most other SaaS businesses, Zoom benefits from a particularly high amount of deferred revenue (unearned revenue) – around $294 million for 2021. Unearned revenue is the revenue for which the company invoiced their customers and got paid, but didn’t offer their services yet. The balance for unearned revenue can be found in the balance sheet on the current liabilities section.
The high amount of free cash flow offers Zoom flexibility and multiple options for investing in further growth. Moreover, this shows that Zoom is generally a light-asset company, that doesn’t require a significant amount of assets to generate revenue. This also applies to most of the software companies that are easily scalable and benefit from low funding requirements.
FY2023 Guidance – A Definite Letdown
Zoom has guided for a revenue around $4.54 billion for 2022. This represents a modest revenue growth of 11% for the full year, which is a fast deceleration from its 2021 results (55% YoY growth).
“In enterprise, we expect that part of our business to grow at approximately 20% year-over-year. Our online business is expected to be flattish for the year” – Zoom’s CFO, February 2022
Zoom will depend on its sales & marketing efforts and upselling opportunities in order to keep growing. As we’ve seen before, this was not a great look for the company. In terms of adjusted operating income (excluding SBC and other non-recurring expenses), it will drop to 32% in 2022 as a result of some investments opportunities that the company will take:
Source: Zoom 10-K FY22
Valuation
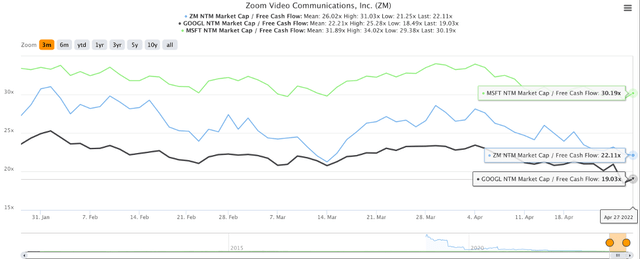
In terms of valuation, Zoom became a lot cheaper during the last couple of months. Since Zoom is now a value company, proved by its solid margins and huge pile of free cash-flow, I believe that one of the best ways to value the company is by looking at its FCF in relation to its Market Cap. Zoom trades at a NTM Market cap / FCF of around 22X. This translates into a 4.55% free cash flow yield that the Zoom stock offers:
Source: TIKR.com
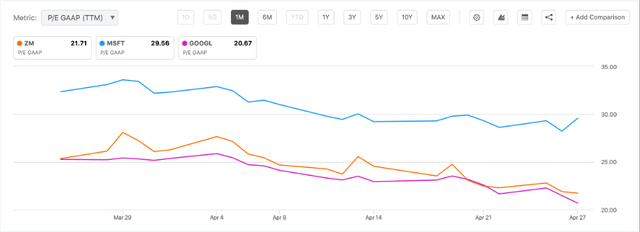
Additionally, since P/E is also meaningful, as you can see below, Zoom trades around 22X TTM P/E. That’s also a 4.55% earnings yield that Zoom provides. This is in line with Google’s and bigger than Microsoft’s:
Source: SeekingAlpha.com
Still, when looking at Earnings per share and their future growth, Zoom has a modest 14.65% CAGR for EPS in the next 3-5 years. This showcases that most of the company’s opportunities to grow earnings might already be in the past:

Source: SeekingAlpha.com
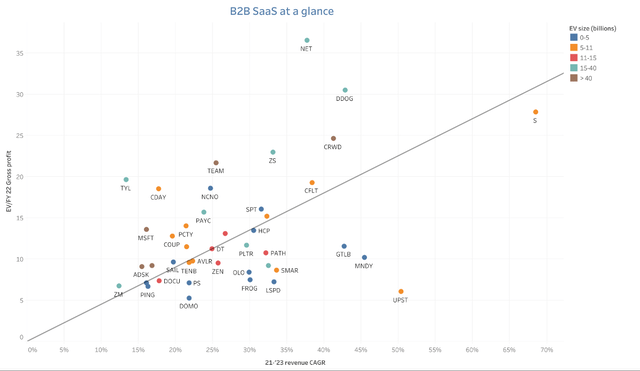
A crucial factor for earnings growth is top-line growth. When compared to other B2B SaaS business, Zoom looks cheap, but we can also see that the company has a revenue CAGR between 2021 and 2023 of only 12.5%. I’ve selected 40 of the most liquid SaaS stocks and Zoom’s revenue growth rate is actually the lowest of all these 40 SaaS companies. This might be the reason why Zoom will only modestly grow its earnings, unless it finds a way to significantly improve its top line.
TIKR.com
Risks
As with any other stock, there’s a chance that the company delivers much better than I anticipated and my thesis goes out the window. One great thing that Zoom definitely has is its management. Being founder-led, in conjunction with a high percentage of insider ownership (around 20%), might help Zoom deliver better results and capture significant market share in adjacent markets (Phone, UCaaS etc). This will definitely move the stock, especially if the company can improve some of its other operating metrics (upselling %, CAC etc.) in the upcoming quarters. I will keep an eye on the things that I highlighted before to see if the company’s performance exceeds my expectations.
Conclusion
Even after considering the work-from-home trend (multiple studies show that a period of 2 days per week of working remotely is the sweet spot for office productivity and employees happiness) and Zoom’s expansion into the into the UCaaS land to take on the market leaders Microsoft and Cisco, I believe that this will take a long time to come to fruition. Moreover, management seems to be cautious with its guidance and this might showcase that a gap period is necessary to find out if Zoom’s transition will be successful.
For now, the extremely low revenue growth, the high cost of acquiring customers and the increased competition from Microsoft convinced me to watch Zoom stock from the sidelines.
