
metamorworks/iStock via Getty Images
Produced By Jason Appel
In this article, we will examine the outlook on Gartner (NYSE:IT). Gartner is an advisory firm that’s a world leader in providing information technology research.
While share prices have dipped in 2022 in the midst of a general risk-off atmosphere in equity markets, the company’s performance remains as solid as ever.
Q1 marked Gartner’s fourth consecutive quarter beating analyst expectations for both revenue and earnings per share. The most recent report of financial performance for Q1 2022, released on May 3, showed EPS of 2.33 beating analyst expectations by over 35%, their biggest beat in the most recent four quarters. As noted by Gene Hall, Gartner’s Chief Executive Officer, this was led primarily by contract value growth (see below).
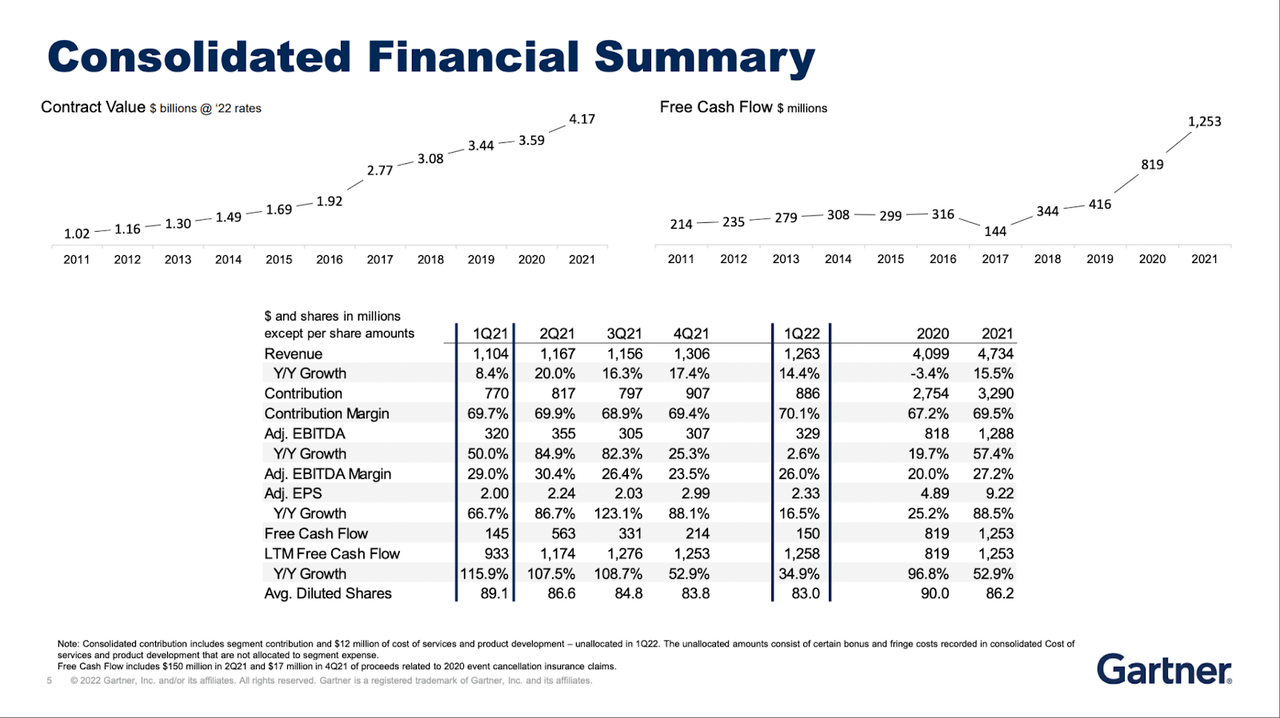
Q1 2022 Earnings Supplement
In addition to Gartner’s consistent financial outperformance, the company has endeavored to return value to shareholders via large volume share repurchases.
From the earnings report press release, Gene Hall, Gartner’s Chief Executive Officer, commented, “Gartner had a strong start to the year, led by contract value growth of 16%, and we are raising our 2022 outlook for Revenue, EBITDA and Free Cash Flow. We bought back more than $630 million of stock through April, which will serve to increase our per share results this year and beyond.”
Though Gartner has dropped significantly in 2022, currently down 27.75% from its 2021 high, it’s crushing the competition on a 12-month rolling basis. In the past year, shares of Gartner have appreciated 14.36% as of the 5/27/2022 close, as compared with a gain of only 1.94% in the same period for the Dow Jones Business Support Services Index. As well, please note the relative outperformance as compared to both its sector and the S&P 500 Index in the chart below:
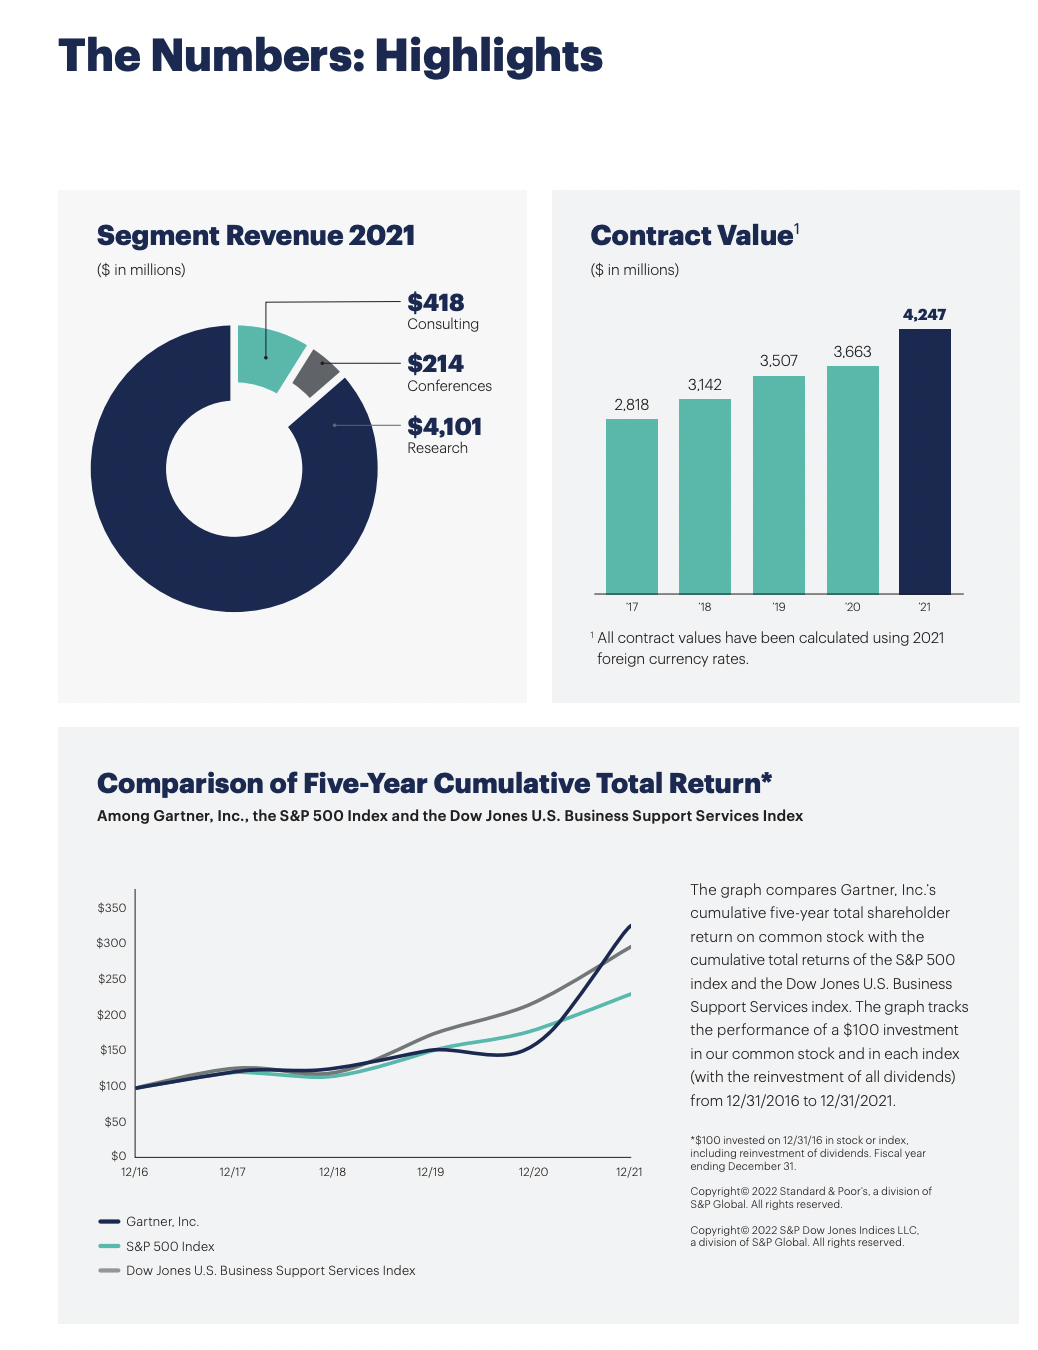
Gartner 2021 Annual Report
From an Elliott Wave Perspective: Gartner has mostly been in a persistent uptrend since its shares went public in October 1993. At a very large degree, zoomed out on a long time frame chart, one can see that our interpretation is that Gartner is nearing a significant high in its larger degree Cycle Wave III.
Elliott Wave characterizes trending patterns in markets as occurring in 5 wave moves in the direction of the trend. This particular pattern meets the criteria for an impulse, which is a 5 wave move in which the motive waves – those that advance price in the direction of the trend – are themselves counted as 5 wave moves that break out strongly in their 3rd waves. These extend well beyond the length of the wave 1, and their 4th waves do not overlap with the first waves.
For the purposes of this article, the analysis focuses on expectations for approximately the next 9-24 months. That said, regarding timing, please note the forecasts only pertain explicitly to price and anything communicated with regard to timing is to be taken extremely loosely.
In Elliott Wave terminology, the analysis pertains to expectation for the final Intermediate wave (5) of Primary (Circle) 5 of Cycle III. Please see the charts below for visual accompaniment.
Gartner has maintained the necessary parameters for an impulsive pattern off the 2002 low. The Primary 3rd wave (circle 3) topped in the summer of 2019 having nicely exceeded its minimum target, the 1.236 extension off the 2002 low. Like many equities, IT dropped strongly in 2020, but as can be seen on the zoomed-out chart, price retraced only a very small portion of the Primary wave 3 advance off the 2009 low.
Since the March 2020 low, Gartner has formed the first 3 waves, (1)-(2)-(3) of an impulsive Primary 5th wave. The recent aforementioned pullback off the 2021 high appears to be nearing completion (and possibly complete). This counts as the wave (4) and its current low is an almost perfect 38.2% retrace of the preceding wave (3). For reference, the 38.2% retrace is considered the “standard” support for a wave (4) in an impulsive Elliott Wave pattern.
So long as wave (4) support is maintained, the larger pattern from the 2020 low favors a higher high, ideally targeting north of $511 (the larger degree 1.764 extension off the 2002 low), but minimally such a rally targets the 2.236 Fibonacci extension off the 2020 low at $433.
Currently, Gartner has yet to provide solid objective evidence that the low to this pullback is in hindsight but the further this recent rally off the May low extends, the more likely it becomes. Ultimately, from an Elliott Wave perspective, our “confirmation” will come with a 5-wave rally off the May low, followed by a 3 wave pullback that maintains above the May low and then a takeout of the high that preceded the 3-wave pullback.
Should Gartner dip to a lower low, such a development can still be seen as providing a valuable entry and constructive so long as no prolonged trading develops below $195-$200. Should that occur, it would strongly challenge the thesis presented here that price will head to higher highs in the upcoming larger market bullish cycle.
Without confirmation of a low in place, the prospect of a lower low looms, but for those finding this opportunity in Gartner to be favorable, such a decline, can be viewed as providing cheaper entries for the next rally in wave (5). Even at current levels, a near-term entry for an addition or initial position offers a favorable risk to reward in our view.
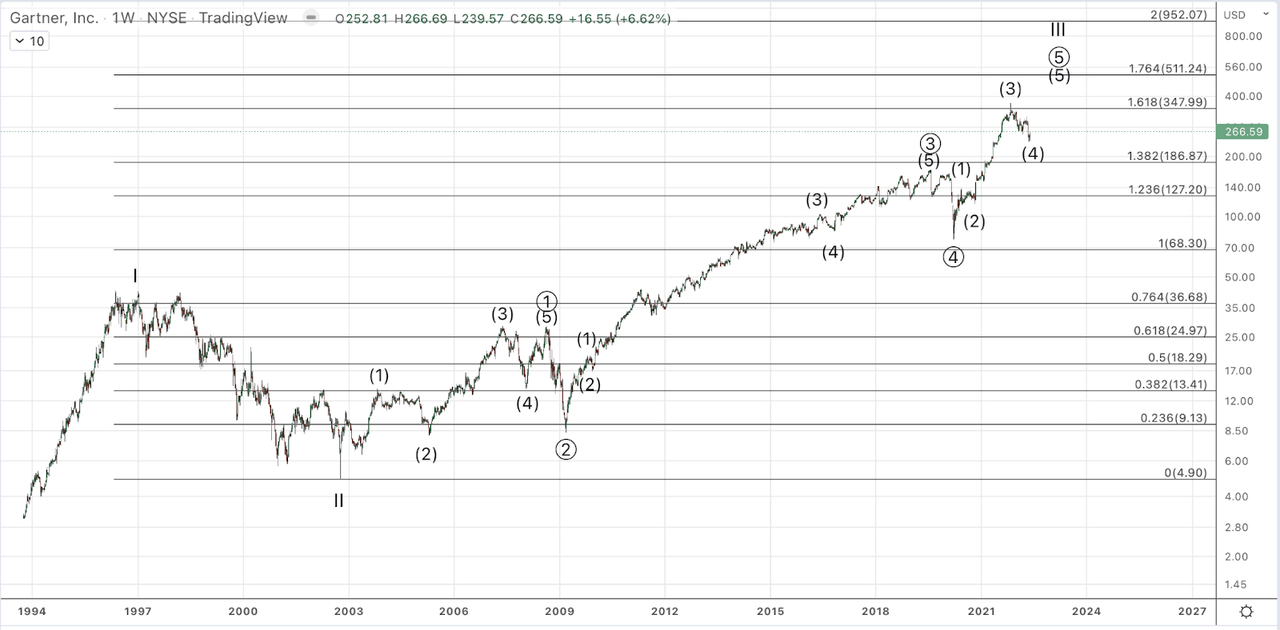
Gartner Weekly Chart (Jason Appel) Stockwaves
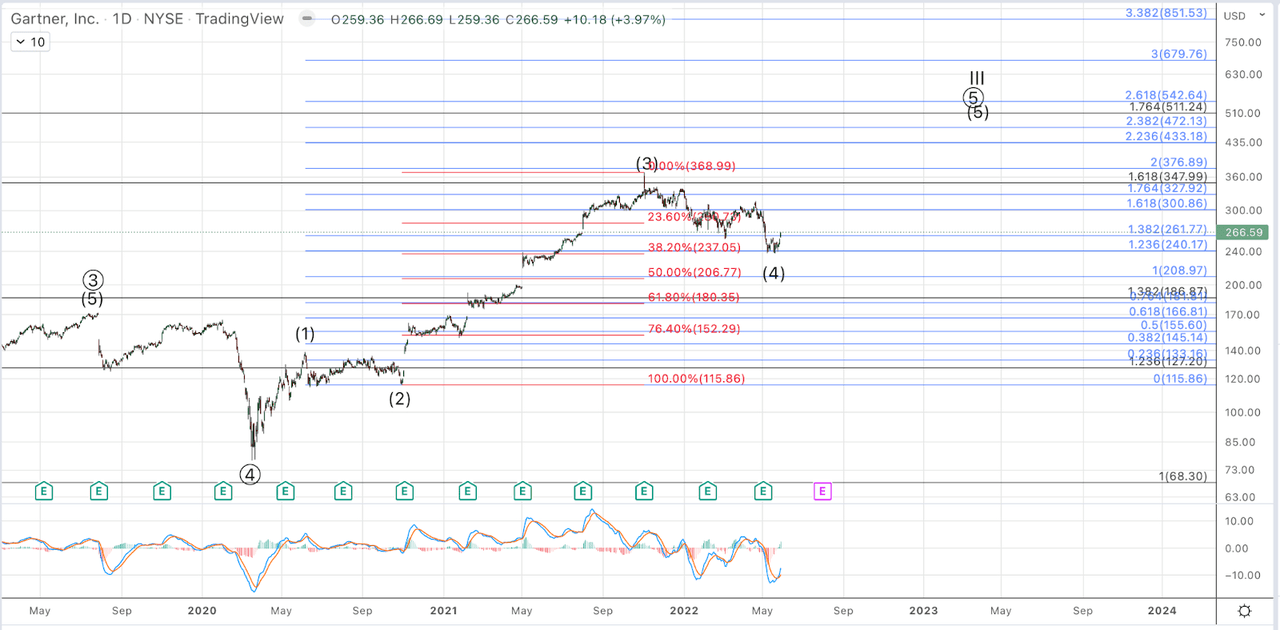
Gartner Daily Chart (Jason Appel) Stockwaves