
MF3d/E+ via Getty Images
Thesis and Background
For readers familiar with our writings, you know that my wife and I like the healthcare sector for our early retirement accounts. We like a simple and concentrated portfolio with about one dozen holdings. And we usually do not hold more than 1 stock per sector. However, the healthcare sector is currently an exception as we are holding both Merck (NYSE:MRK) and AbbVie (NYSE:ABBV). In this article, you will see why we like both these healthcare leaders. I’ve written about the healthcare sector before. For example, my recent coverage on ABBV, published back in May, compared it to Bristol Myers Squibb (BMY).
In this article, I will follow a similar approach and compare it to MRK. This updated comparison is motivated by two considerations. First, I wanted to provide the comparison under context of MRK’s and ABBV’s Q2 earnings report released last week. Second, my last article focused entirely on their finances, and in this article, I wanted to provide an update on the pipeline too. As and you will see that our considerations for holding both mainly fall in the following buckets:
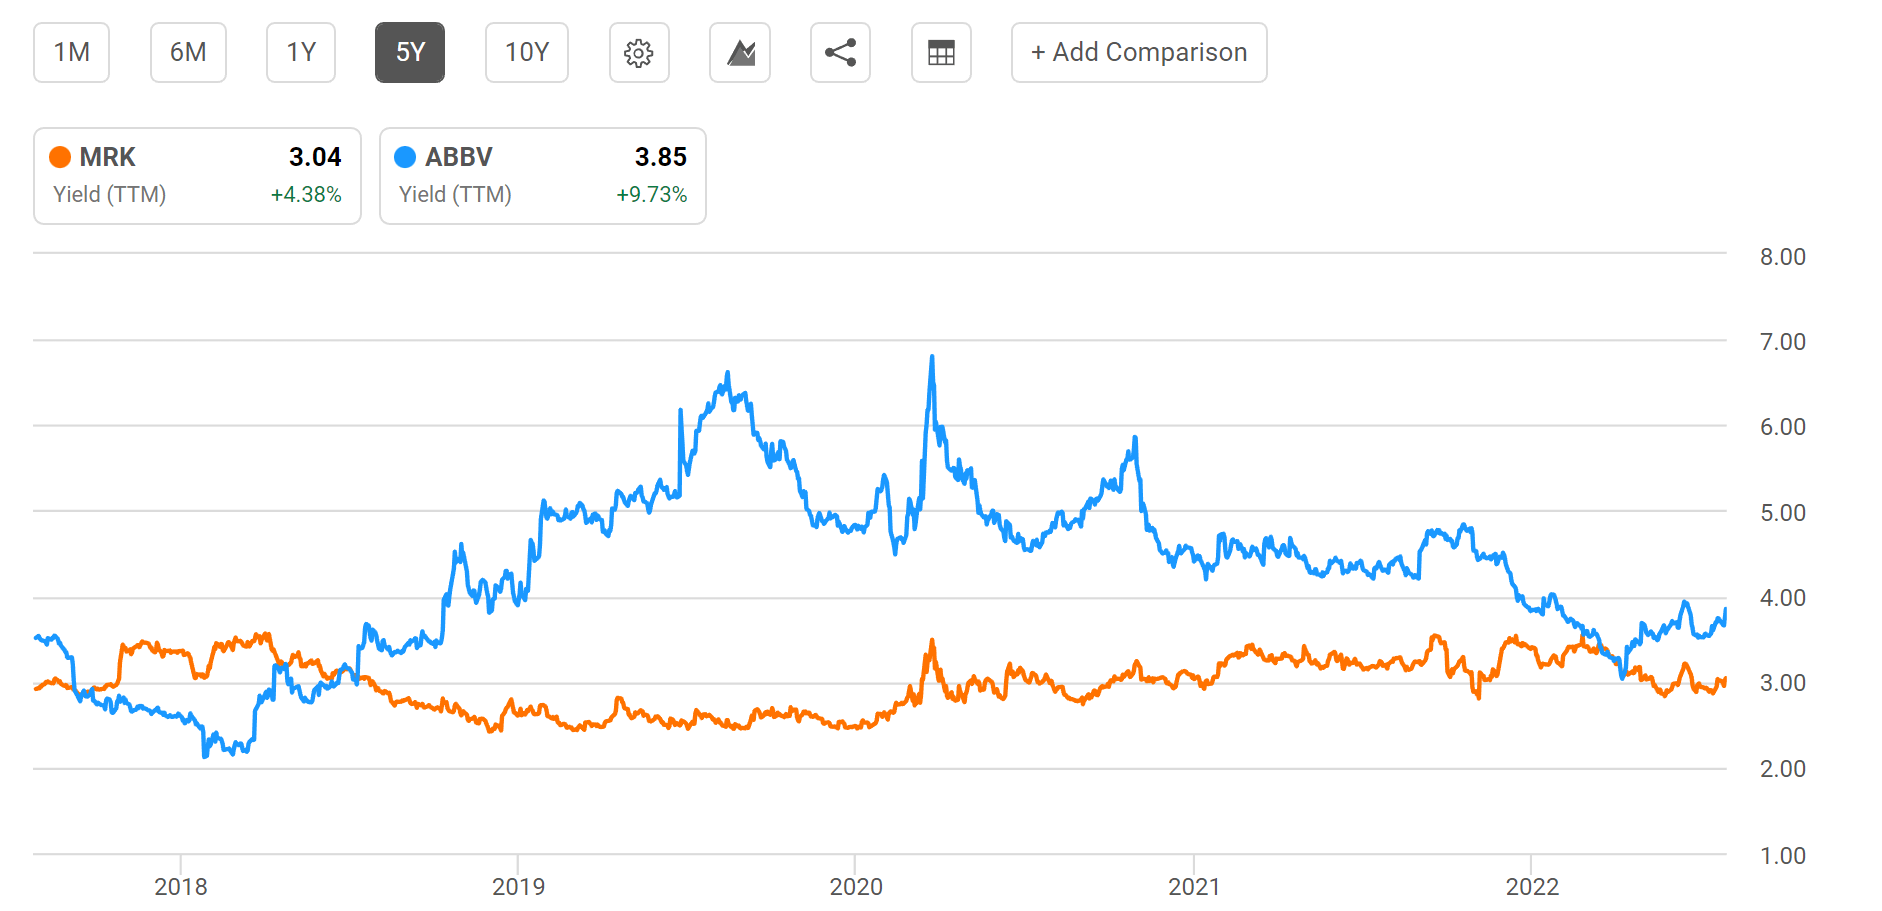
A) they both provide generous and safe dividend income for the long term. MRK is currently yielding 3.04% and ABBV 3.85% as you can see from the chart below, both substantially higher than treasury rates (10-year rates just dropped to 2.64% last week) and the overall market (the S&P 500 is yielding about 1.46% now).
Seeking Alpha
B) Their dividends are supported by a strong pipeline and superb profitability as you will see in the next section. Both feature a strong portfolio consisting of blockbuster drugs and deep pipelines in their core areas. They have demonstrated consistent dividend management in the long-term and their current cushion ratios are far above the 1x threshold (MRK is at 1.9x and ABBV is at 2.45x).
C) And finally, both are trading at a very reasonable valuation and provide a good margin of safety. MRK is valued at about 12x FW PE and ABBV at about 10.3x only. You will see later that such valuation leaves a wide margin of safety and provides favorable odds for double-digit returns in the long term.
The remainder of this article will dive in and elaborate on the above aspects.
Merck vs AbbVie: Q2 Pipeline updates
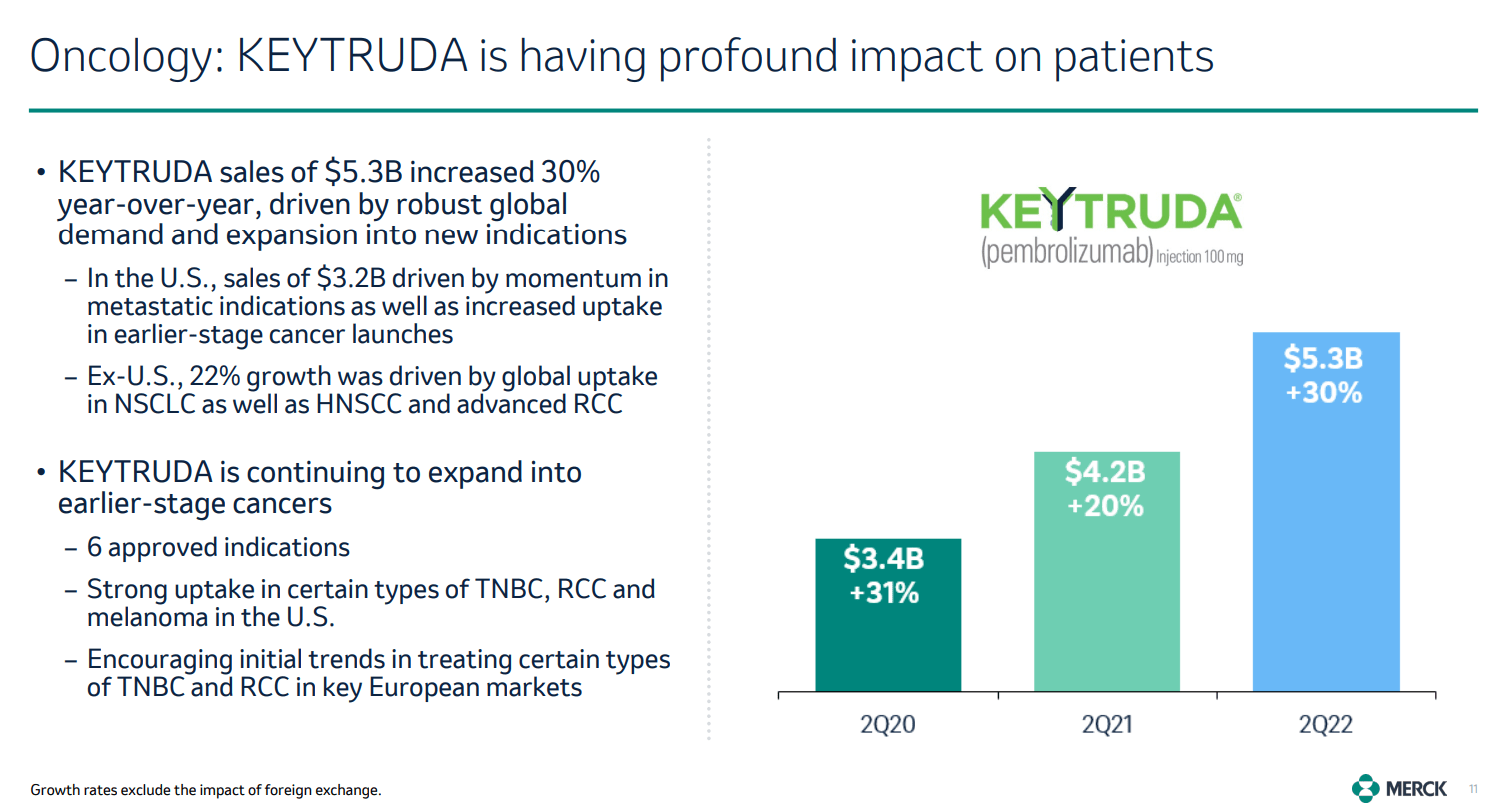
Both companies enjoy a strong and deep pipeline. For MRK, a highlight involves its cornerstone oncology franchise Keytruda. The franchise roughly contributes 30% of its top line. And Keytruda franchise has been enjoying robust growth.
Its Q2 sales dialed in at $5.3B, an increase of 30% year-over-year, driven by robust demand in the non-small cell lung cancer market and also expansion into new indications. To broaden the view a bit, its Q1 sales increased 23% YoY also. Its U.S. sales grew to $3.2B in Q2, largely driven by momentum in metastatic indications as well as increased uptake in earlier-stage cancer launches. Another major asset for MRK’s overall business is its vaccine segment. Here, it has reported strong acceleration also. Gardasil sales reached $1.7B in Q2, an increase of 40% YoY, mostly driven by strong demand outside the U.S. To broaden the view a bit again, its Q1 sales grew by +59%.
Looking ahead, I see the strong demand to continue. For example, I see the demand in China to continue providing a tailwind in the coming quarters, especially for its Gardasil and potentially its new COVID-19 pills too.
MRK Q2 earnings report
For ABBV, the elephant in the room has always been the replacement drugs for its Humira. It is true that the immunology business is its core asset, and accounts for about 45% of ABBV’s top line currently. And its aging blockbuster Humira continued to fall out. Sales declined by about 3% in Q1. And sales were down 7.3% operationally in Q2 in the ex-U.S. market due to biosimilar competition. Although U.S. sales reported 9.6% growth in Q2 (the patent will expire in the U.S. in 2023).
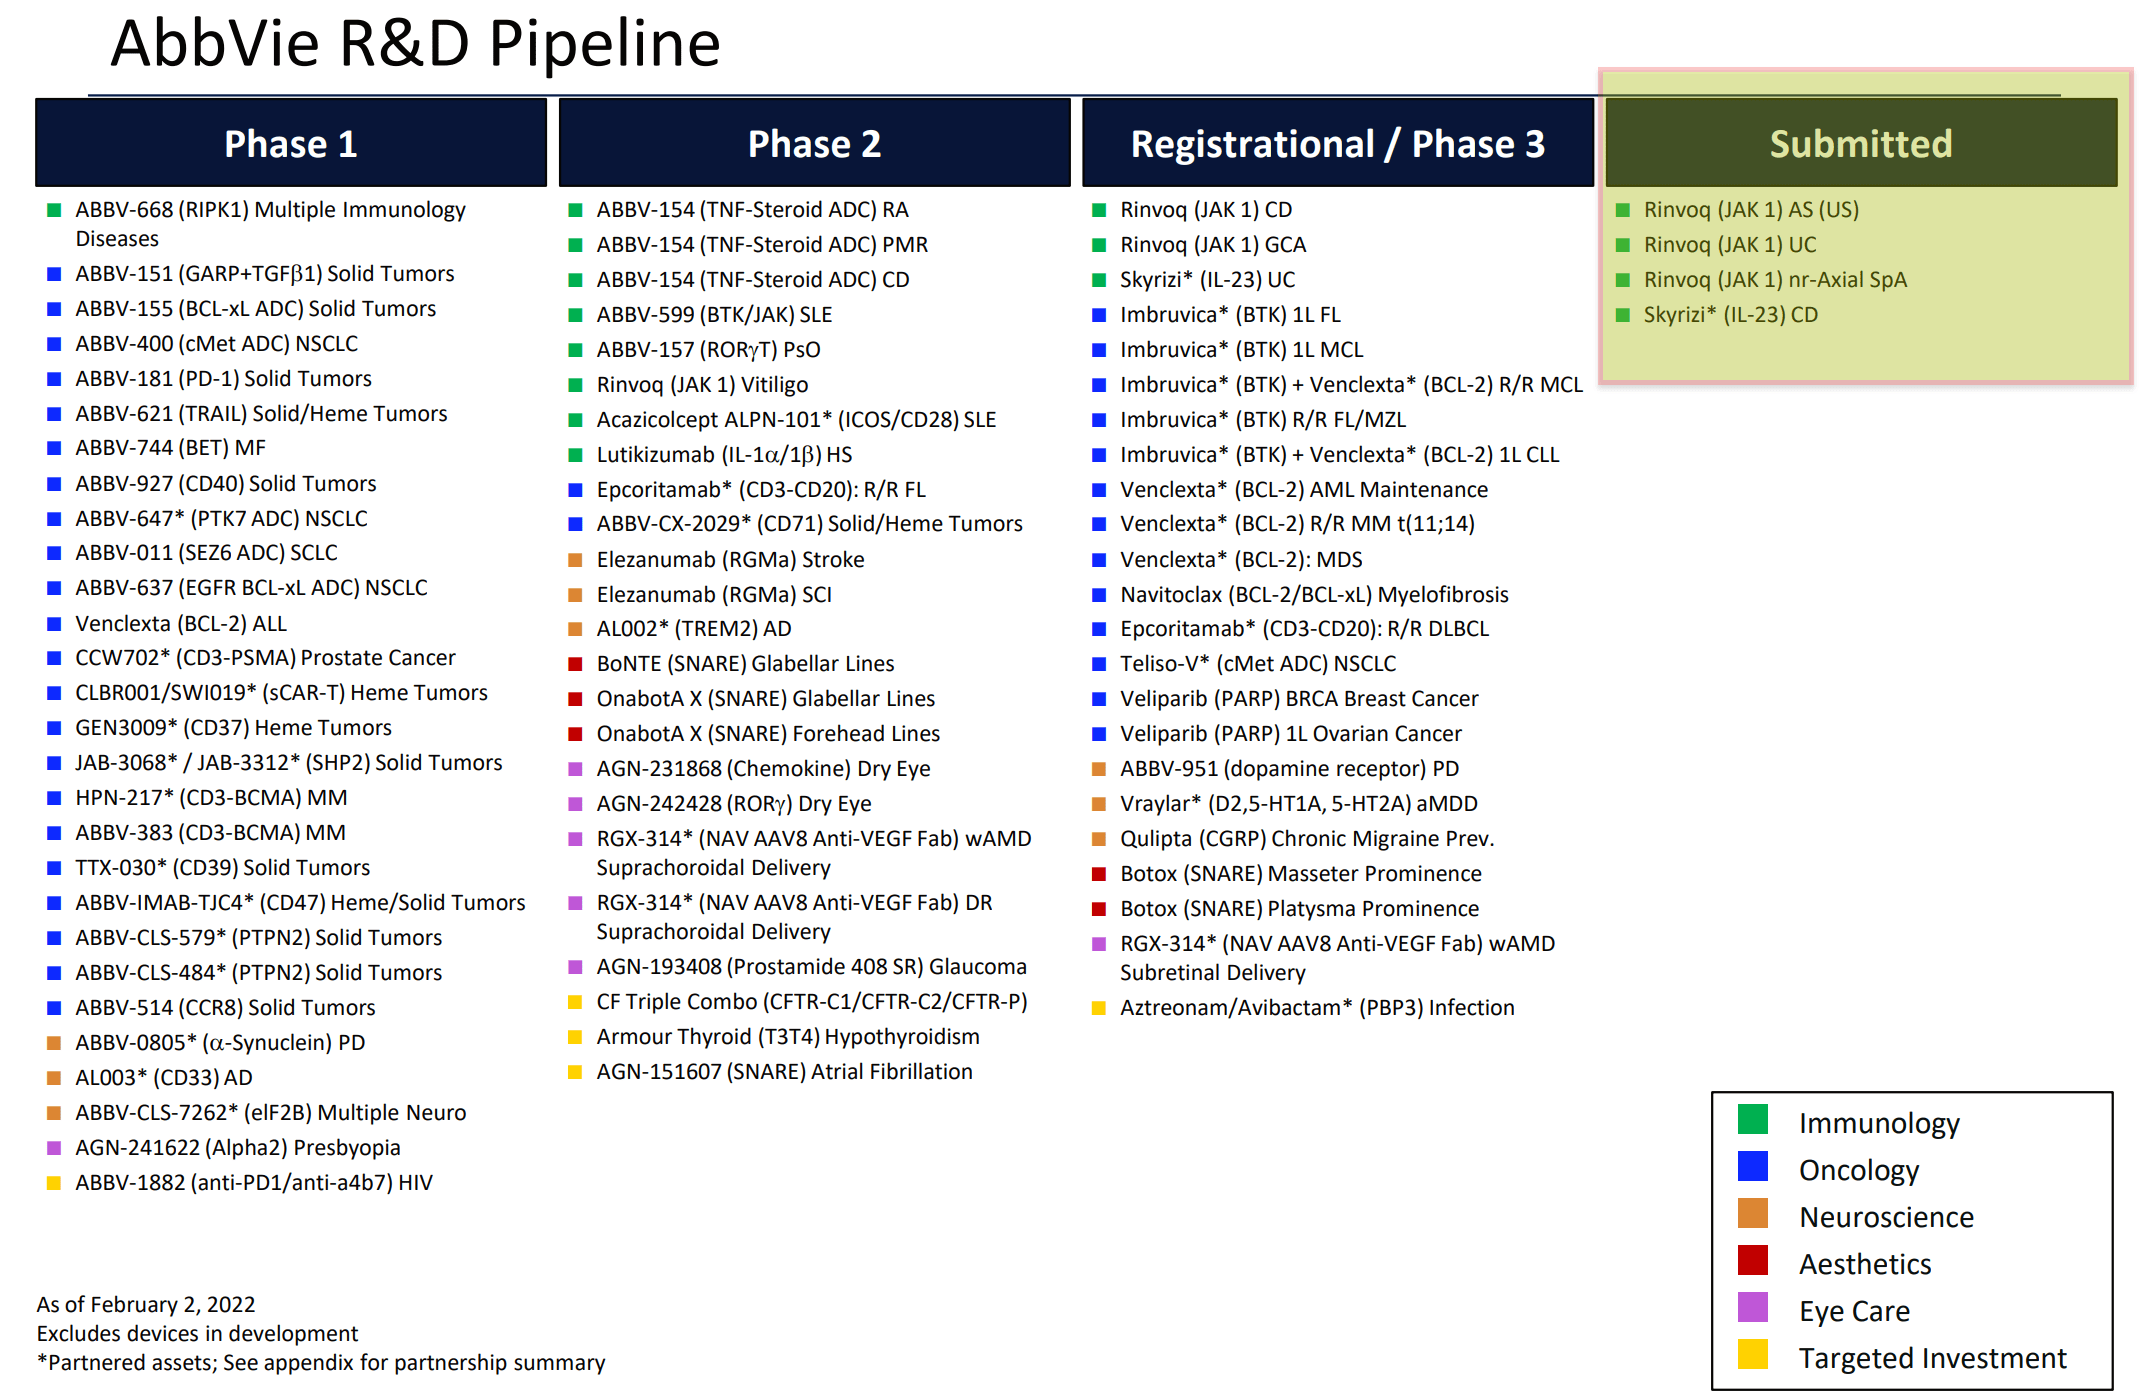
However, I see the concern for Humira as overblown for at least two reasons. For, robust gains from promising new assets Skyrizi and Rinvoq are showing very promising signs (highlighted in the chart below). They have been posting spectacular growth recently. Take Skyrizi as an example, its sales grew by 64% in Q1 and global revenues grew another 33% on a sequential basis in Q2, exceeding management expectations. As its CEO Rick Gonzalez commented (abridged and emphases added by me):
Total net revenues of approximately $14.6 billion was up 6.1% on an operational basis, in line with our expectations. This performance reflects robust double-digit operational sales growth from immunology, where Skyrizi is exceeding our expectations with impressive market share gains in both psoriasis and PSA. Skyrizi’s recent U.S. approval in Crohn’s disease will add yet another source of long-term growth. As a result of the strong performance, we’ve seen in the first half of the year, we are raising our full year guidance for Skyrizi.
Secondly, its other assets such as its aesthetics and neuroscience portfolios have also been posting robust growth (in the ~15% to ~20% YoY level) in recent quarters. The strong uptake in its Botox product line is a highlight here. Global Botox Therapeutic net revenues came in at $678 million in Q2, an increase of 12.6% percent on a reported basis or 14.5% percent on an operational basis.
ABBV pipeline 2022 update
Superb profitability and dividend safety
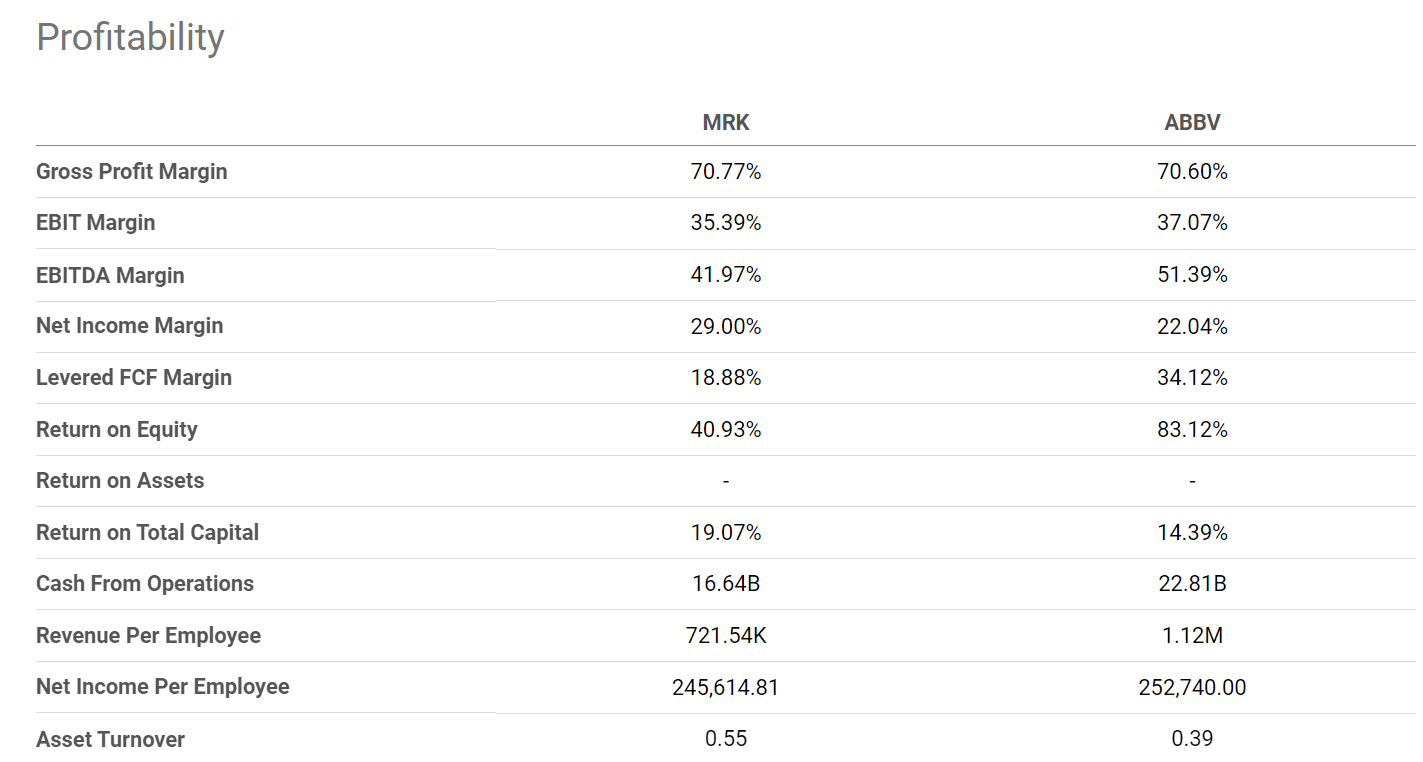
Their strong portfolio and pipeline provide a wide moat to their profitability and dividends. As aforementioned, both MRK and ABBV currently offer an attractive dividend yield of about 3% and 3.85%, respectively. Dividends from both are supported by healthy profitability as you can see from the following chart. Comparing profitability is ultimately subjective and my impression here is that they both enjoy superb profitability when the metrics are considered holistically. For example, both MRK and ABBV enjoy a remarkably high gross margin above 70%. MRK boasts a higher net income margin of 29% compared to ABBV’s 22%. To put things under perspective, the average profit margin for the overall economy fluctuates around 8% and rarely goes above 10%. To make up for the lower net margin, ABBV enjoys a much higher FCF margin (34% vs 18%).
Also, note that ABBV’s ROE of 83% is distorted and not comparable here given its unique capital structure. Although its return on total capital is 14%, a bit lower than MRK’s 19%. Finally, ABBV is also larger in absolute sizes ($22.8B of operation cash vs $16B from MRK). A larger scale correlates with safety.
Seeking Alpha data
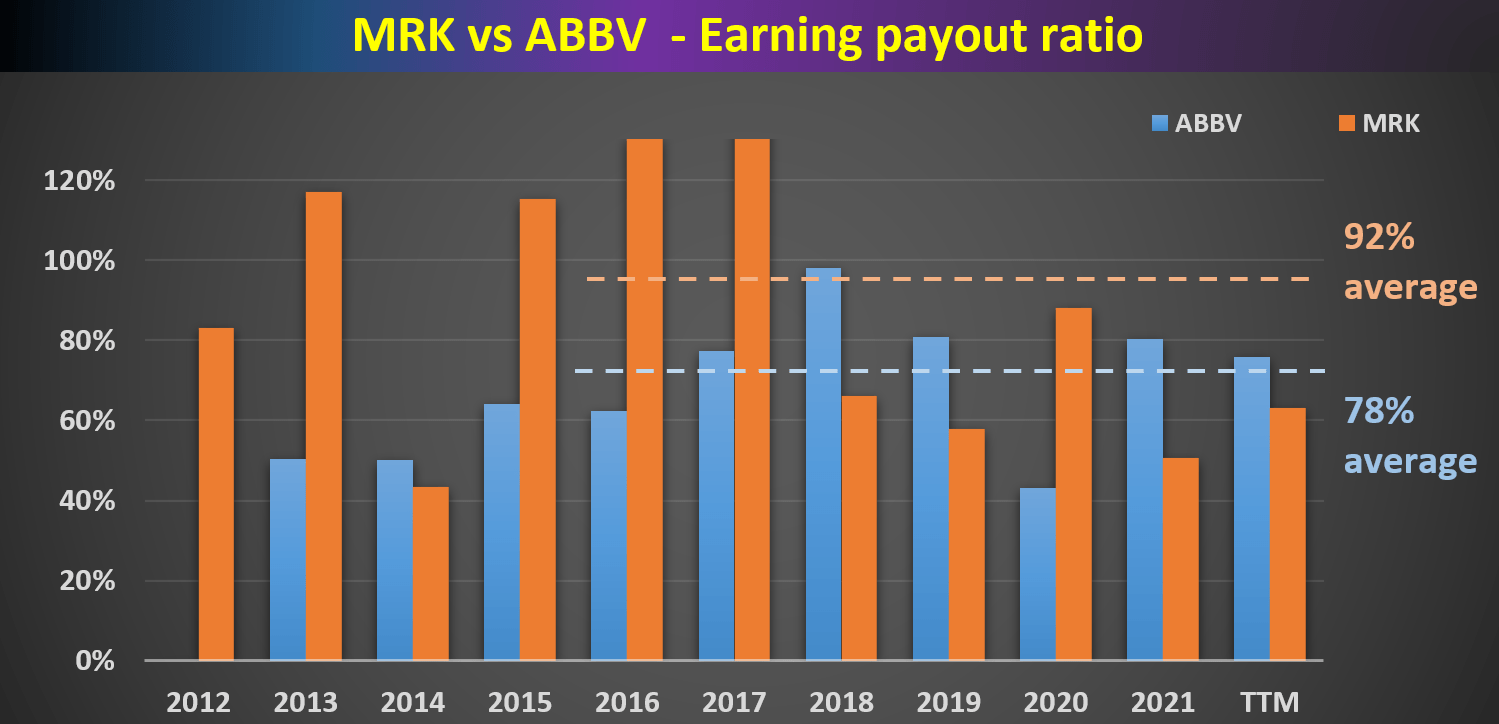
And I’m sure we’re all familiar with the standard criteria for determining dividend safety, such as earnings payout ratio and cash flow payout ratio. The payout ratios of MRK and ABBV are shown in the figures below in terms of earnings and cash flow. As can be seen, MRK and ABBV have both managed their dividend payouts quite consistently in the past, and ABBV even more so. ABBV’s earnings payout ratio has been on average 78% in recent years, lower than MRK’s 92% by a large margin of 14%.
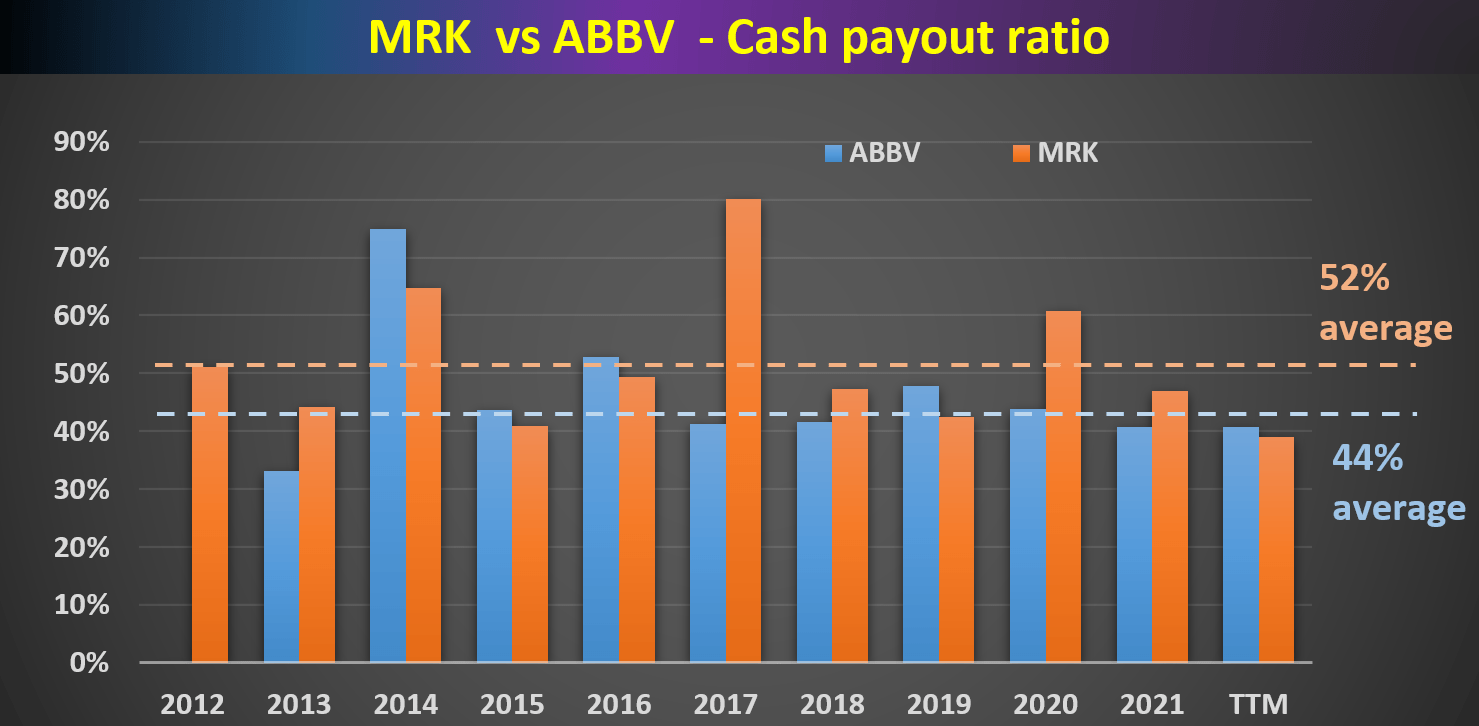
The cash payout ratio paints the same picture as seen in the second figure. Here again, ABBV’s payout ratio has been on average 44% in recent years, lower than MRK’s 52% by about 8% this time.
Author based on Seeking Alpha data
Author based on Seeking Alpha data
Dividend cushion ratios
As detailed in my earlier article here, there are major limitations of the above simple payout ratios. And we find the dividend cushion ratio an effective tool to overcome these limitations. A detailed description can be found in our earlier articles or Brian M Nelson’s book entitled Value Trap. And a summary is quoted below:
The Dividend Cushion measure is a ratio that sums the existing net cash (total cash less total long-term debt) a company has on hand (on its balance sheet) plus its expected future free cash flows (cash from operations less all capital expenditures) over the next five years and divides that sum by future expected cash dividends (including expected growth in them, where applicable) over the same time period. If the ratio is significantly above 1, the company generally has sufficient financial capacity to pay out its expected future dividends, by our estimates. The higher the ratio, the better, all else equal.
We made one revision to the above method here. Instead of subtracting the total long-term debt, we subtracted the total interest expenses over a past five-year period. This revision is to adjust for the status of businesses like MRK and ABBV. Such mature businesses probably will never have the need to repay all the debt at once. But it does need to service its debt.
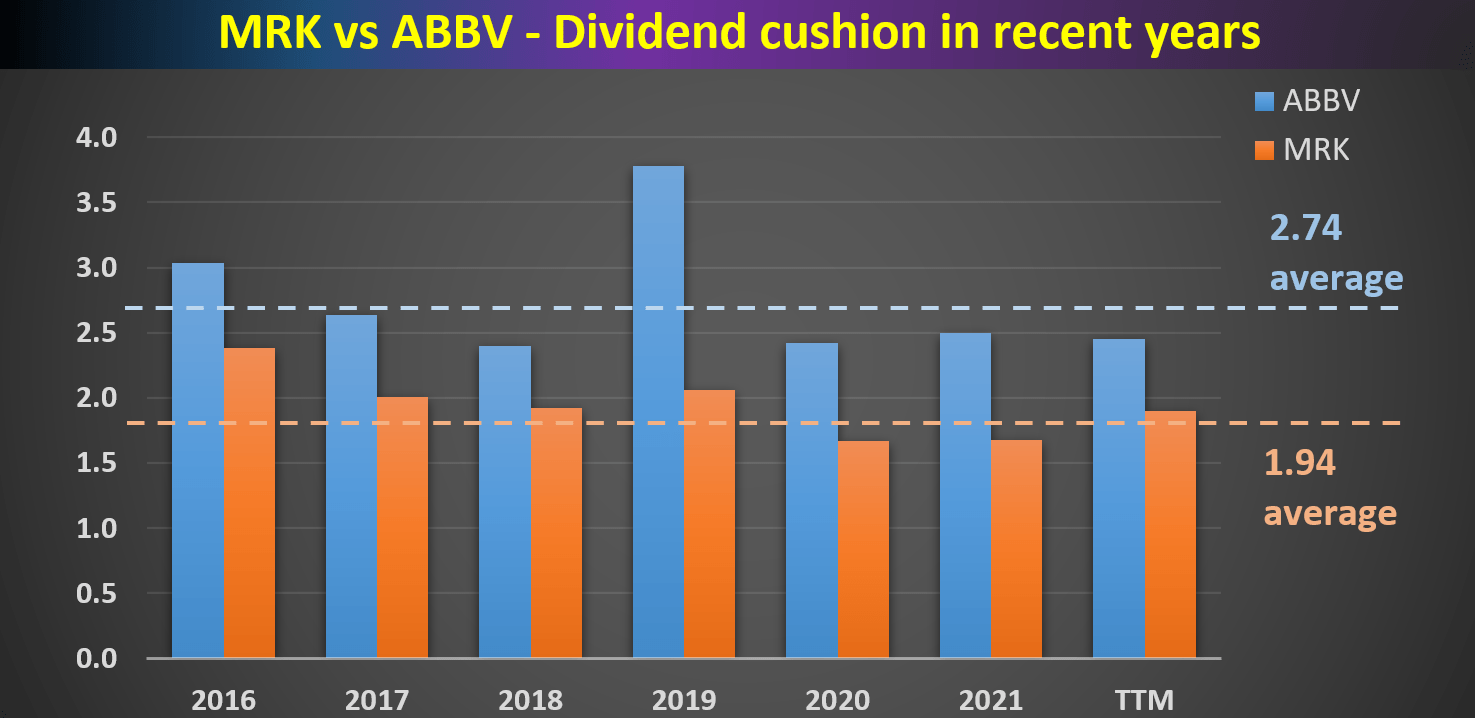
With this background, the dividend cushion ratios for MRK and ABBV are calculated and shown below. As can be seen, MRK has been maintaining an average dividend cushion ratio of 1.94x in recent years, and ABBV has been maintaining an even higher cushion ratio of 2.74x.
In particular, MRK’s current cushion ratio is at 1.9x and ABBV is at 2.45x. Although both are lower than their historical averages, both are significantly above 1 (the threshold for safety) and also substantially above more other businesses we’ve analyzed.
Author based on Seeking Alpha data
MRK vs ABBV: Valuation and Projected Returns
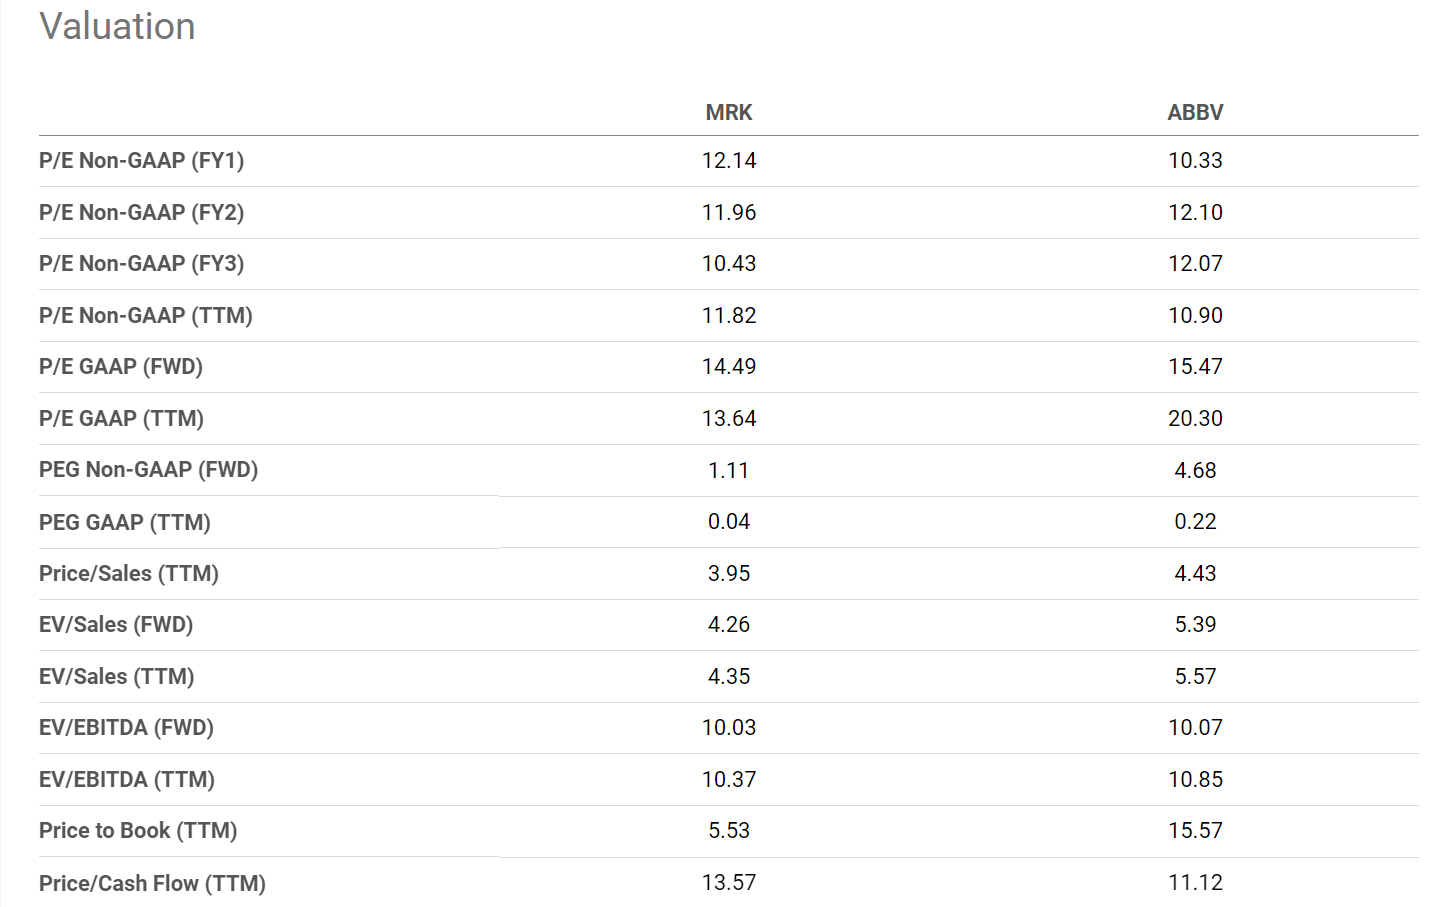
Finally, valuation. The following table compares their valuation. As can be seen, there are some variations in their valuations depending on which metric you focus on. Overall, MRK is a bit more expensively priced than ABBV. But my view is that their valuations are both very reasonable.
MRK is valued at about 12.1x FW PE and ABBV at 10.33x FW only. In terms of cash flows, MRK is valued at 13.5x cash flow and ABBV at 11.1x cash flow. To put things under historical perspective, MRK’s average valuation is somewhere between 11x to 14x cash flow in the past 5 years (on an annually averaged basis). And for ABBV, its average valuation has been somewhere between 10x to 11x in the past decade. So, both are trading very close to their historical average valuation, possibly with a small discount of around 10%.
Looking forward, I am projecting both to grow their profit at about 5~7.5% per year in the next few years. MRK probably will have a higher growth rate close to the upper bound of this range. ABBV will have a bit larger uncertainty in its growth. The sales of Humira after its expiration are a key variable. Given the current valuation discount, my projections for their total return in the next few years would be a bit above their growth rates. I project a total return in the 7.5% to 10% range.
Finally, note that in both cases, a large fraction of the total return (about 1/3 to 1/2) will be supported by their current dividends, adding another layer of safety to the investment.
Seeking Alpha data
Conclusion and risks
Based on my analysis and projections, both MRK and ABBV currently offer very favorable risk-adjusted total return potential, both in the near future and a few years out. Both provide stellar financial strength, strong and deep pipeline, and a stable moat, which are all key considerations for our early retirement portfolio. The return potentials are further underpinned by their generous dividend payouts, which will support about 1/3 to ½ of the total investment return based on my estimates.
Finally, risks. ABBV is facing some near-term headwinds. And management had to reduce its 2022 adjusted earnings outlook in Q1. The guidance was lowered from $14.00-$14.20 a share to $13.78 and $13.98. The headwinds included the market dynamics for Imbruvica, higher inflation, and also the stronger U.S. dollar. These headwinds are likely to persist in the near future.
For MRK, its profits too are susceptible to the foreign currency exchange rates. It also expects a negative impact on its U.S. sales caused by the shift towards new adult pneumococcal vaccine. Also, its Animal Health segment has been adversely impacted by the pandemic, and it’s unclear when the trend would reverse.