Feline Lim
Since our previous analysis of Apple Inc. (NASDAQ:AAPL), the company’s stock had risen by 23% and is nearing our previous price target of $173. Apple’s revenue grew by 2% in Q3 FY2022 while its Mac revenue declined by 10% YoY which was attributed to supply constraints according to management.
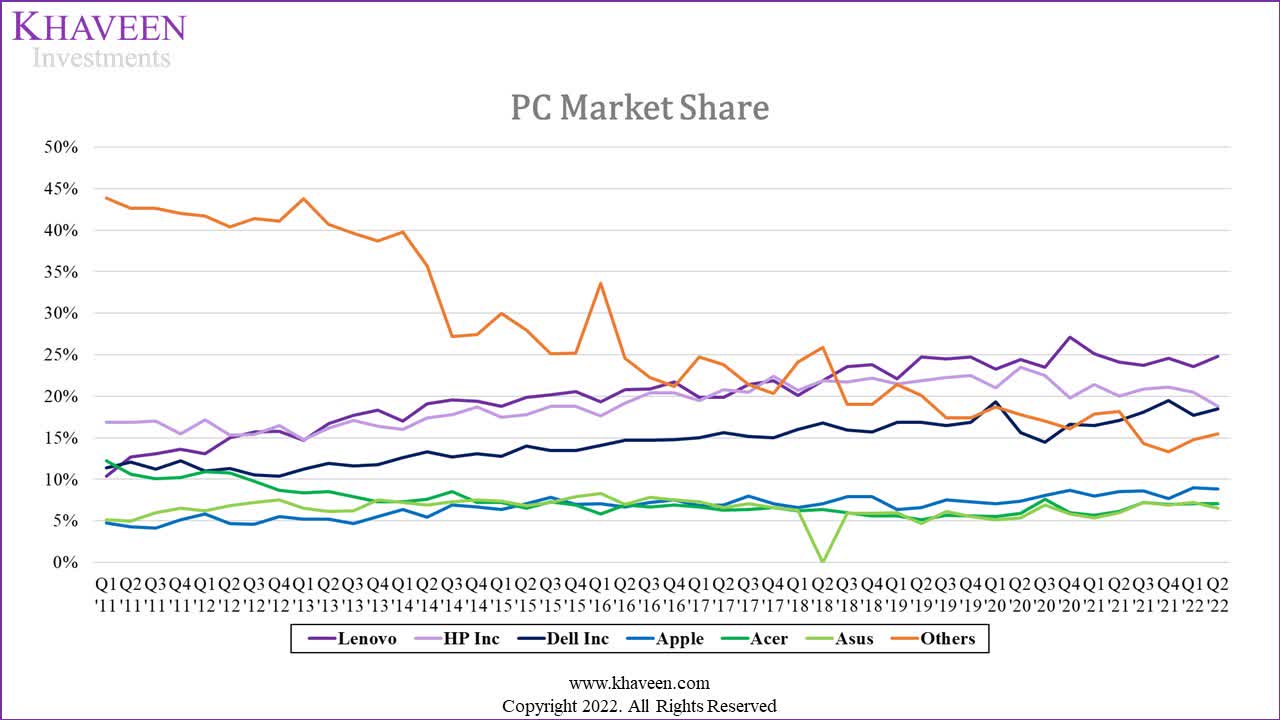
Gartner, Khaveen Investments
In the PC market, Apple remained the 4th largest company by market share in Q2 2022 and was the only company among the top 6 PC makers to have positive shipments growth (9.3% YoY) during the quarter while the others had negative shipments growth. On the other hand, Lenovo (OTCPK:LNVGY) maintained its position as the market leader since 2018 and had competed fiercely with second place HP (HPQ) for the leading position. Followed by that, Dell (DELL) remained in third place.
Thus, in this analysis, we analyzed the company’s Mac business segment to determine the possible factors to explain the company’s superb performance in the PC market. Firstly, we compared its CPU performance against its competitors such as AMD (AMD) and Intel (INTC) by comparing their average CPU benchmark scores to determine Apple’s competitiveness and whether it has a performance advantage.
Moreover, to determine whether the company has the pricing power to increase its Mac products, we analyzed the historical pricing trend for its MacBook Pro and Air models as well as compared its average prices against the top 6 PC makers. Based on this, we forecasted the ASP growth for its Mac segment.
Moreover, we also compared its Mac products against other PC brands in terms of customer satisfaction and product quality based on the NPS scores and average PC product review scores, then forecasted its shipments growth to project its Mac segment’s total revenue growth.
No CPU Performance Advantage Against Intel and AMD
In July, Apple released its new 13-inch MacBook Air and MacBook Pro which are both powered by its latest M2 chips, the successor to its previous M1 gen. Apple’s management in the latest earnings briefing highlighted the performance increase of new M2 chips as stated in the quote below.
M2 delivers a faster CPU, GPU and neural engine along with higher memory bandwidth and new capabilities like Pro Res acceleration. And it continues the tremendous pace of innovation in Apple silicon for the Mac. – CEO Tim Cook
To determine whether Apple Silicon chips have a performance advantage against competitors, we analyzed the performance of its Apple silicon chips by comparing the PassMark CPU scores for both its M1 and M2 chips as well as compared it against Intel and AMD based on our previous analysis where we analyzed a total of 33 Desktop and Notebook CPUs for their latest gen to obtain the average CPU scores. In terms of Apple Silicon, we compiled the average score based on 6 versions of its M1 and M2 for both Desktop and Notebook categories.
|
Company |
Notebook |
Desktop |
Overall PassMark CPU Score |
|
Intel |
19,458 |
26,714 |
23,086 |
|
AMD |
21,058 |
39,826 |
30,442 |
|
Apple |
18,250 |
22,071 |
20,161 |
Source: PassMark, Khaveen Investments
Based on the table above, Apple trails behind both Intel and AMD with a lower average overall CPU benchmark score for both desktop and notebook from PassMark by 13% for Intel and 34% for AMD. In both Notebook and Desktop, AMD has the highest average CPU score followed by Intel and then Apple. Thus, we believe this highlights the better performance of its chips compared to Apple. That said, Apple’s new M2 chip has a higher PassMark CPU score compared to its previous base variant (8 core) at a slight increase of 2.7% indicating better performance for its new chip.
Overall, despite the launch of the company’s new M2 chips with slightly better performance than its previous gen based on its PassMark score which is higher by 2.7% compared to M1, Apple’s chip performance still lags behind Intel (13% lower) and AMD (34% lower) as evidenced by its lower average PassMark CPU scores for both desktop and notebook which we believe highlights that it does not have a performance advantage against these competitors. However, the company was reported to be developing its next-gen M2 Max and Pro chips to be built on TSMC’s (TSM) 3nm process node according to DigiTimes and could launch in its next MacBook Pro models between 2022 and 2023 based on Bloomberg.
Limited Pricing Power for ASP Increase
With the lack of a performance advantage for Apple’s chips as discussed above, we then examined its product pricing to determine whether it had the pricing power to raise its prices based on its historical starting launch prices in the table below where we compiled its prices for its MacBook Pro (13-inch) and Air models based on their chipsets.
|
Base Model Launch Price |
MacBook Pro (13-inch) ($) |
Growth % |
MacBook Air ($) |
Growth % |
|
M2 |
1,299.00 |
0.0% |
1,199.00 |
20.0% |
|
M1 |
1,299.00 |
0.0% |
999.00 |
0.0% |
|
2020 (10th‑generation Intel Core i5) |
1,299.00 |
0.0% |
999.00 |
-9.1% |
|
2019 (9th Gen Intel Core i5) |
1,299.00 |
-27.8% |
1,099.00 |
-8.3% |
|
2018 (8th Gen Intel Core i7) |
1,799.00 |
38.5% |
1,199.00 |
20.0% |
|
2017 (8th Gen Intel Core i5) |
1,299.00 |
999.00 |
Source: Mac World, Tom’s Guide, Khaveen Investments
Based on the table, the new MacBook Air with the M2 chipset commands a higher price tag by 20% compared to its previous-gen but the new MacBook Pro still has the same starting price at $1,299. The company’s MacBook Pro (13-inch) has a 5-year CAGR of 0% while its MacBook Air has a 5-year CAGR of 3.7%. When Intel was used as the chipset for its previous models, Apple only raised its prices in 2018 and either maintained its prices or reduce them in the following years. For its 2018 Apple MacBook Pro, the starting price increased to $1,799 as the base model included the Apple TouchBar while its previous model did not for the base model but was an add-on which increased the starting price to $1,799. Though, in 2021, Apple announced that it removed the TouchBar from its MacBooks. Moreover, Apple had introduced larger versions of the MacBook with 16-inch and 14-inch models which have higher starting prices compared to its 13-inch models.
Moreover, we then compared Apple’s prices against its competitors among the top 6 PC makers in the table below. We compiled the average prices of 10 PC models for each competitor.
|
Company |
Average PC Prices ($) |
|
Apple |
1,532 |
|
Lenovo |
1,389 |
|
Dell |
1,176 |
|
HP |
1,508 |
|
Acer |
1,171 |
|
Asus (OTC:AKCPF) |
1,438 |
|
Average |
1,369 |
Source: Company Data, Khaveen Investments
As seen above, Apple has the highest average PC prices among the top PC makers with an average of $1,532 followed by HP, Asus and Lenovo. The only companies with below-average prices are Dell and Acer. Thus, we believe this further supports our belief that the company has limited pricing power to increase its pricing as it is already the highest among competitors.
Therefore, as analyzed the historical prices of Apple’s MacBook Pro and Air, we believe the company does not have the pricing power to increase its ASPs. Furthermore, we analyzed the company’s average PC prices which is the highest compared with its top PC competitors and believe this furthers justifies our belief that the company has a limited ability to increase its product pricing.
Solid Customer Satisfaction and Quality Supports Growth
To analyze the competitive positioning of Apple and other PC makers, we then examined their branding and product reviews by compiling their NPS score and average PC reviews from NanoReview of 59 total PCs for the top 6 PC makers.
|
Company |
NPS Score |
Average PC Review |
5-Year Shipment CAGR |
|
Apple |
54 |
66 |
8.5% |
|
Lenovo |
16 |
55 |
8.0% |
|
Dell |
27 |
49 |
6.9% |
|
HP |
-3 |
51 |
1.3% |
|
Acer |
22 |
51 |
5.8% |
|
Asus |
31 |
56 |
3.0% |
|
Average |
24.5 |
54.8 |
5.6% |
Source: Comparably, NanoReview, Khaveen Investments
As seen in the table, Apple has the highest Net Promoter Score (‘NPS’) among the top 6 PC makers which is a “customer loyalty and satisfaction measurement”. The company’s NPS score of 54 is well above the average NPS score of 24.5 and is followed by Asus (31) and Dell (27). We believe this highlights Apple’s strong branding and reputation among customers. Additionally, in terms of average PC reviews from NanoReview, we found that Apple also has the highest average PC review score at 66 followed by Asus and Lenovo while the other PC makers had below-average PC review scores, indicating Apple’s better PC quality.
Based on this, we believe Apple’s strong customer satisfaction and product quality support its high shipment growth rate at a 5-year CAGR of 8.5% which is the highest among competitors. On the other hand, HP had the lowest PC reviews and was also the only company with a negative NPS score. We believe this and, as determined in the previous point, its high average PC prices (2nd highest), we believe this is one of the reasons for its lowest shipments growth. Overall, we believe the factor for Apple’s impressive performance in the PC market is due to its high customer satisfaction and product quality.
|
Mac Revenue Projections ($ bln) |
2019 |
2020 |
2021 |
2022F |
2023F |
2024F |
2025F |
2026F |
|
Mac Shipments (‘mln’) |
18.4 |
20.8 |
26.9 |
26.8 |
27.39 |
27.98 |
28.57 |
29.18 |
|
Growth % |
0.4% |
13.3% |
29.4% |
-0.4% |
2.1% |
2.1% |
2.1% |
2.1% |
|
Mac ASP ($) |
1401 |
1140 |
1308 |
1308 |
1308 |
1308 |
1308 |
1308 |
|
Growth % |
1.1% |
-18.7% |
14.7% |
0.0% |
0.0% |
0.0% |
0.0% |
0.0% |
|
Mac revenues ($ bln) |
25.7 |
23.7 |
35.2 |
35.07 |
35.82 |
36.58 |
37.36 |
38.15 |
|
Growth % |
1.5% |
-7.8% |
48.4% |
-0.4% |
2.1% |
2.1% |
2.1% |
2.1% |
Source: Apple, Gartner, Khaveen Investments
We forecasted the company’s Mac segment based on unit shipments and ASP growth. For its unit shipments, we projected its 2022 growth based on the prorated Q1 to Q3 fiscal year shipments and growth beyond 2022 on the IDC PC forecast CAGR of 1.6% but we believe Apple could continue to grow higher than the market supported by its high customer satisfaction and quality. Thus, we accounted for a 1.52 growth factor on the market CAGR based on its past 5-year shipments over the average market shipment growth (8.5%/5.6%) to obtain a growth rate assumption of 2.1%. For its ASPs, we assumed a 0% growth as we believe the company’s pricing power to increase ASP is limited as discussed in the points above. Overall, we forecasted its Mac revenue growth at a 5-year forward average of 1.6% through 2026.
Risk: Supply Chain Disruption
Despite the high satisfaction and reviews, the company’s Mac business segment revenue declined by 10% YoY in Q3 2022 as the company highlighted supply constraints on its Mac business as the Shanghai lockdown affected its supply chain. Management also cited that it continues to have supply constraints for Mac. According to Bloomberg, the launch of its next-gen M2 Max and Pro MacBooks could launch between 2022 and 2023 depending on the supply constraints. Thus, we believe this could affect the company’s Mac business segment growth if the supply constraints persist or worsen. In our previous analysis on Apple, we highlighted the COVID-19 lockdowns in Shanghai, China, and the suspension of production of Apple’s EMS providers including Pegatron. Based on the share of Apple’s suppliers of 48% based in China and 10% within China from Shanghai, we estimate an impact of 0.32 mln Mac shipments and 1.2% of Mac revenue based on Apple’s FY2021 total Mac shipments (26.9 mln) prorated by 1 quarter as the lockdown began in April and ended in June 2022.
We continue to have supply constraints with Mac, but we’re encouraged by the strong response from customers to our incredible lineup. – CEO Tim Cook
Valuation
We updated our revenue projections for Apple with our analysis for its Mac segment while retaining our projections for all other segments from our previous analysis. However, compared to our previous analysis, we obtained a lower 5-year forward average revenue growth at 9.4% compared to 9.6% previously.
|
Apple revenues |
2019 |
2020 |
2021 |
2022F |
2023F |
2024F |
2025F |
2026F |
|
iPhone |
142.4 |
137.8 |
192.0 |
192.53 |
200.90 |
211.00 |
221.60 |
232.74 |
|
Growth % |
-14.1% |
-3.2% |
39.3% |
0.3% |
4.3% |
5.0% |
5.0% |
5.0% |
|
Mac |
25.7 |
23.7 |
35.2 |
35.07 |
35.82 |
36.58 |
37.36 |
38.15 |
|
Growth % |
1.5% |
-7.8% |
48.4% |
-0.4% |
2.1% |
2.1% |
2.1% |
2.1% |
|
iPad |
21.3 |
28.6 |
31.9 |
33.18 |
34.54 |
35.96 |
37.44 |
38.98 |
|
Growth % |
14.5% |
34.5% |
11.3% |
4.1% |
4.1% |
4.1% |
4.1% |
4.1% |
|
Wearables, home and accessories |
24.5 |
30.6 |
38.4 |
45.89 |
53.51 |
60.79 |
67.25 |
72.38 |
|
Growth % |
40.8% |
25.0% |
25.3% |
19.6% |
16.6% |
13.6% |
10.6% |
7.6% |
|
Services |
46.3 |
53.8 |
68.4 |
83.96 |
103.32 |
126.90 |
155.74 |
191.63 |
|
Growth % |
20.4% |
16.2% |
27.2% |
22.7% |
23.1% |
22.8% |
22.7% |
23.0% |
|
Total |
260.2 |
274.5 |
365.9 |
390.6 |
428.1 |
471.2 |
519.4 |
573.9 |
|
Total Growth % |
-2.0% |
5.5% |
33.3% |
6.8% |
9.6% |
10.1% |
10.2% |
10.5% |
Source: Apple, Khaveen Investments
We valued the company with a DCF analysis as we expect it to continue generating positive FCFs. We based its terminal value on a weighted average of the top software and hardware companies at an average EV/EBITDA of 14.83x.
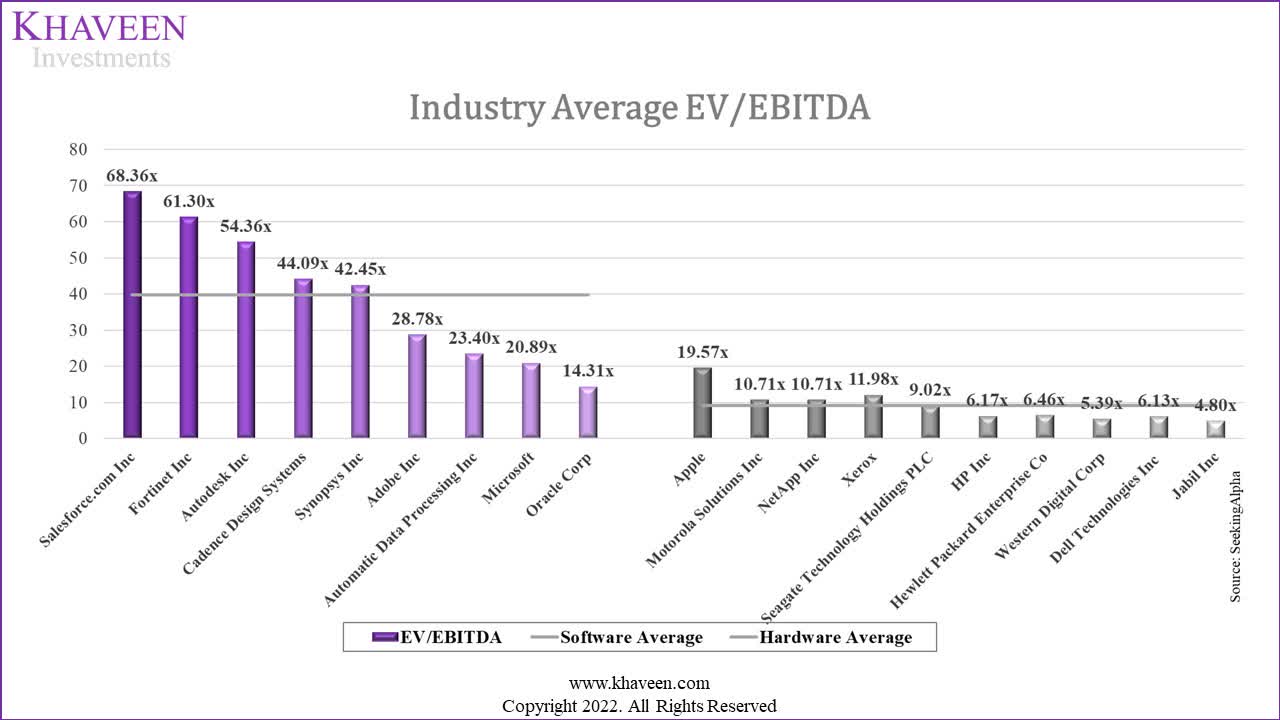
SeekingAlpha, Khaveen Investments
|
EV/EBITDA |
Revenue ($ bln) |
Weight |
Weighted Average |
|
Product (Hardware) |
297.4 |
81.3% |
9.09x |
|
Service (Software) |
68.4 |
18.7% |
39.77x |
|
Total |
365.9 |
100.0% |
14.83x |
Source: SeekingAlpha, Khaveen Investments
Based on a discount rate of 8.8%, our model shows its shares are fairly valued with an upside of 6%.
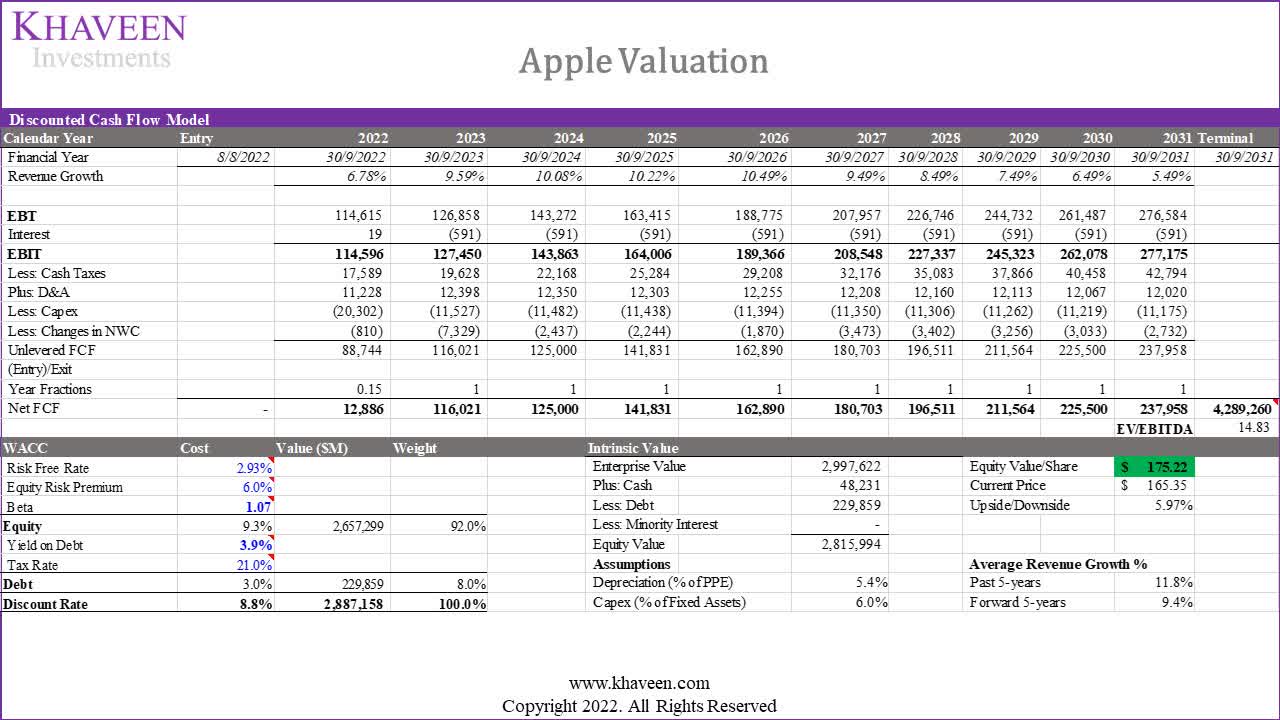
Khaveen Investments
Verdict
To conclude, Apple’s performance in the PC market had been remarkable as it gained market share and had the highest 5-year shipments CAGR among the top 6 PC makers. We analyzed its Mac segment and determined that despite the launch and transition to Apple Silicon, it still lags behind competitors AMD and Intel with higher average CPU benchmark scores which indicates a lack of a performance advantage for Apple. Also, we analyzed its historical pricing change and determined its limited pricing power with flat product pricing on top of its high prices in comparison to competitors. However, we believe Apple has the advantage in terms of customer satisfaction and product quality as it has the highest NPS and average PC reviews among competitors which we believe could support its growth and forecasted its Mac revenue growth at a 5-year average of 1.6% taking into account the supply disruptions in 2022. Notwithstanding, Apple’s stock price has risen by 23% since our last analysis and is nearing our price target although slightly lower at $175.22 due to our lower revenue projection at a 5-year average of 9.4% compared to 9.6% previously. As such, this turns our previous Buy rating into a Hold.