
Rasi Bhadramani
Investment summary
Globus Medical, Inc. (NYSE:GMED) continues to offer compelling long-term value in both its niche characteristics and return on investment differentials to peers in the space. Whilst it operates in a capital-intensive environment, its return on invested capital easily surpasses the WACC hurdle and the growth in investment each year. The company is a long-term cash compounder in a defensible industry. With shares traded down since May/June, they are well priced at current valuations, with plenty of long-term upside capture on offer. We rate GMED a buy on a $110 valuation.
Exhibit 1. GMED 6-month price action

Data: Refinitiv Eikon
Q2 earnings report – record top-line growth
Second quarter earnings were strong with upsides relative to consensus at the top and bottom lines. Sales of ~$264 million (“mm”) were up ~500bps YoY and a record quarter for the company. Following difficult comps in Q2 FY21 the company still recognized its first $100mm month.
Geographically, US turnover came in at $225mm, up 470bps YoY [20% annualized], ahead of stipulated North American market growth of ~5.3%, implying GMED captured additional market share during the quarter. Meanwhile, international sales came in ~690bps ahead at $38.4mm, underpinned by expansion of the global robotics portfolio.
Segmentally, musculoskeletal sales were up 170bps YoY as the trauma portfolio continues to see upside. US spine sales saw a record quarter and 250bps YoY growth, whereas the enabling technologies division was the standout across the portfolio. It saw a 44% YoY gain to $29mm, again a record for the company. The company also recognized its 35,000 procedure milestone in its robotics segment – itself growing 30% YoY.
Moving down the P&L and gross margins saw a 60bps YoY decline secondary to cost inflation and various headwinds impacting global supply chains. It does not forecast these trends to continue. Meantime, it recognized a $17.4mm R&D cost that came in to 6.6% of turnover, up ~40bps YoY. Meantime, Q2 GAAP net income lifted 31.4% YoY to ~$55.5mm printing earnings of $0.56 per share – flat YoY.
GMED brought this down to FCF of $13mm for the quarter, itself down from a difficult comp of $51mm in free cash conversion for Q2 FY21. However, it also bought back ~$144.5mm of its own stock, with more than $150mm remaining under authorization for the repurchase program.
With the performance, it reiterated FY22 full-year guidance of $1.02 Billion in sales and a non-GAAP EPS of $2.10 for the year. Speaking on the company’s FY22 results, CFO, Keith Pfeil said:
“I am pleased with our performance and note the resilience of our employees and partners as we manage through inflationary pressures, supply chain challenges and currency fluctuations. As we enter the back half of 2022, we are focused on driving continued share taking across our implant businesses, while we continue to expand on the sales of our technology to the marketplace, driving operational performance, managing execution and maintaining cost discipline are key focus items for our team as we continue throughout 2022, which will drive long-term shareholder value.”
As seen in Exhibit 2, GMED has managed the pandemic-period to date fairly well. FCF yield has remained steady rolling between 2-3%, whereas gross-operating income has remained equally as defensive. Over recent quarters, FCF yields have crept up and even managed to do so through the pandemic, as seen below. With that in mind, GMED carries terrific fundamental momentum into the forward-looking climate.
Exhibit 2. FCF yields have remained steady and when cancelling out qualitative data – this is exemplary of resilient factor we want exposure to
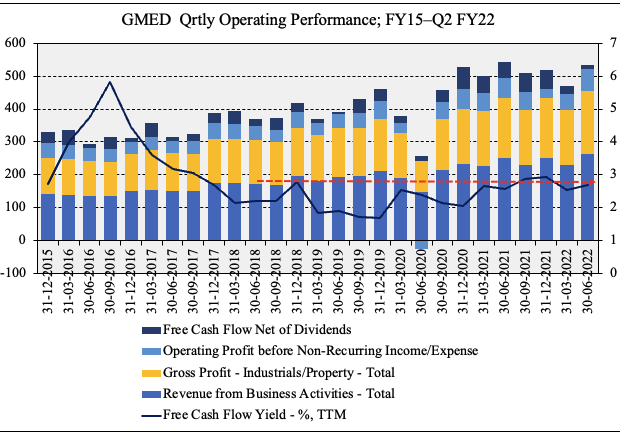
Data: HB Insights, GMED SEC Filings
Additional features of resiliency are observed when examining GMED’s return on investment. In terms of corporate value, it’s best to think in terms of investment value and continuing value [earnings]. Return on investment (“ROIC”) has been cyclical for the company, in-line with its capital budgeting cycle whereby substantial. Later in the discussion we made the necessary adjustments to GMED’s GAAP earnings in order to reflect its true corporate value. The following series of charts demonstrates the change in data following.
For instance Exhibit 3 demonstrates the relationship between FCF yield and ROIC for the company. However, post adjustment to earnings and investment, the picture is quite different as noted in Exhibit 4.
Exhibit 3. Sequential ROI and FCF yield has remained steady and cyclical throughout the pandemic, in line with capital budgeting cycle
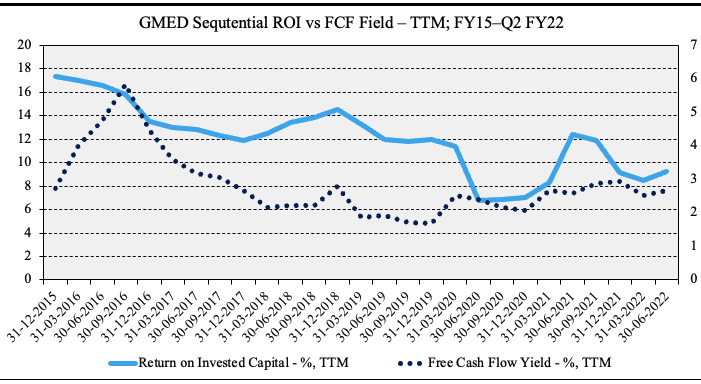
Data: HB Insights, GMED SEC Filing
As seen below, after capitalizing GMED’s R&D expenditure and amortizing it on a straight line basis with a 5-year useful life, its return on investment continues to creep up on a QoQ basis. It came in at c.15% for the last quarter on an adjusted basis [74% annualized], more than seven turns ahead of the company’s annual WACC of 10.04%. This is incredibly important as it demonstrates that whilst GMED is a capital-intensive operating model – particularly on its capital placements – it generates more than sufficient return on this on an quarterly basis. Resilient factors when looking ahead.
Exhibit 4. Adjusting for GAAP recorded investment then we note ROIC reverts to the upside for GMED demonstrating it has a more than firm grasp on its capital-intensive operating model
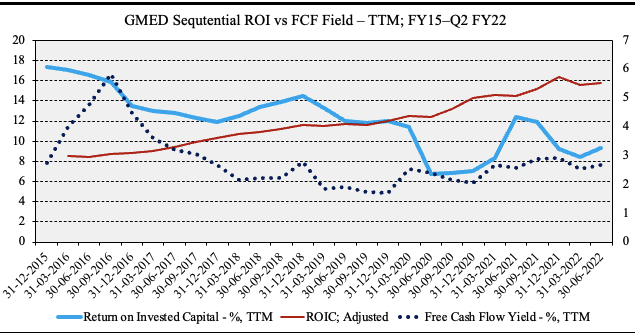
Data: HB Insights; GMED SEC Filings
Finally, we observe the cyclical nature of GMED’s invested capital and return on investment in the exhibit below. In particular, both quarterly and TTM figures are cyclical and in line with capital investment of the company. In particular, we’ve seen NOPAT ratchet up alongside the previous period’s invested capital on average since FY18, and through the pandemic. Moreover, as seen on the right of the chart below, both market and corporate value have been responsive to this investment/return on investment cycle. With recent upturns in each, we believe further upside is warranted on the chart.
Exhibit 5. As capital investment increases sequentially so too does NOPAT conversion. Meanwhile, return on investment remains cyclical and in-line with swings in market/corporate value.
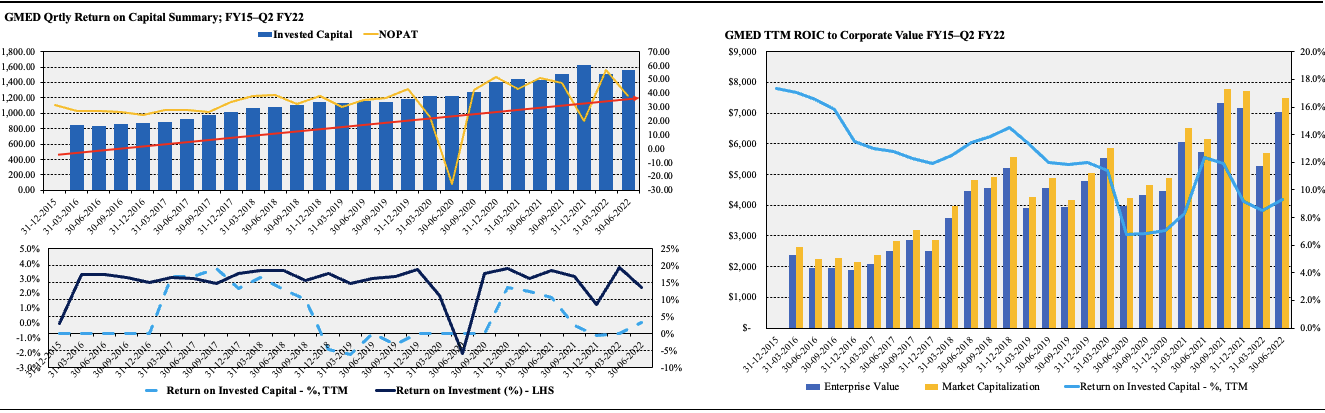
Data & Image: HB Investments US Equity Fund
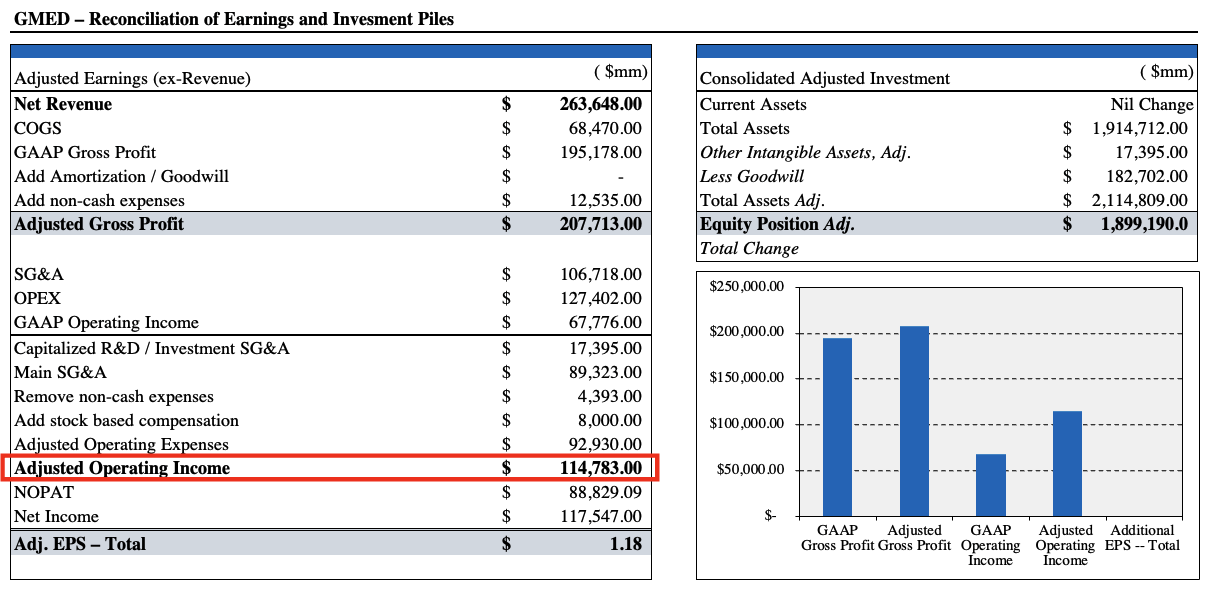
Reconciliations for valuation
Seen in the exhibit below, below adjusted gross profit, we capitalize ~$17.4mm in R&D and remove $4.4mm in amortized intangibles, and add back $8mm in stock-based compensation to reconcile GMED’s GAAP earnings to produce its cash earnings. This sees operating income lift to $114.7mm and earnings now a respectful $1.18 per share.
In addition, we back out $182mm in goodwill from the balance sheet to arrive at an adjusted equity value of $1.9 Billion for the company. Each of these have implications to valuation measures below.
Exhibit 6.
Data: HB Investments US Equity Fund
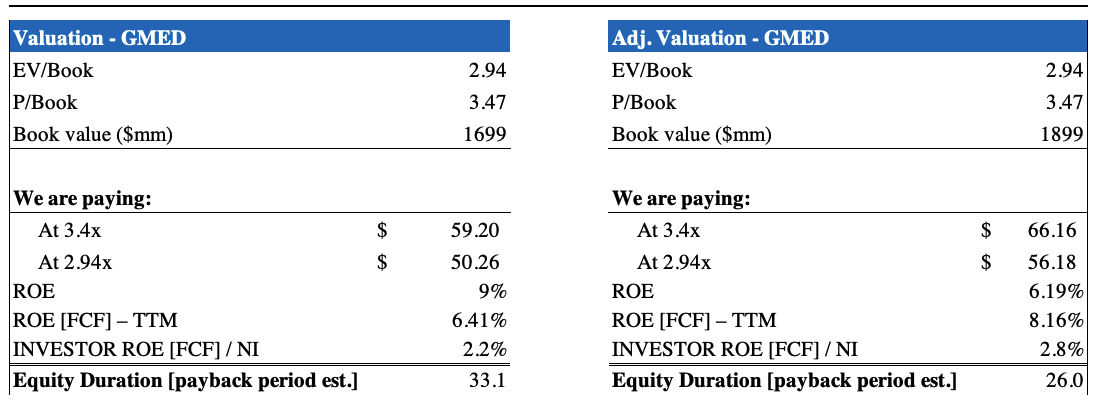
Valuation
After the necessary adjustments, and on a multiple of 2.95x enterprise value (“EV”) to book value, we’d be paying an implied price of $56-$66. On GAAP earnings, the range is $50-$59. Each scenario could represent compelling value – we’ve demonstrated GMED’s strengths on the investment front, and now we need to see continuing value in earnings.
Exhibit 7.
Data: HB Insights Estimates
The effect of post-adjusted earnings is magnified in the exhibits below. As observed, with non-GAAP and GAAP differentials to forward earnings estimates the valuation widens up substantially. After our adjustments on a forward-looking basis, we price GMED at $110 per share. So we’d be paying, say, $66 at the upper end to receive ~$35 in upside potential. On current market prices, this price objective represents a 70% return potential. At a fair cost of equity of 12.5% to accept this risk, this also represents an asymmetrical value to the upside.
Exhibit 8. Large spread in valuation output depending on GAAP or non-GAAP earnings
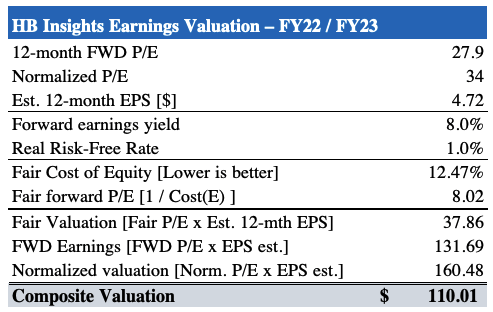
Data: HB Insights
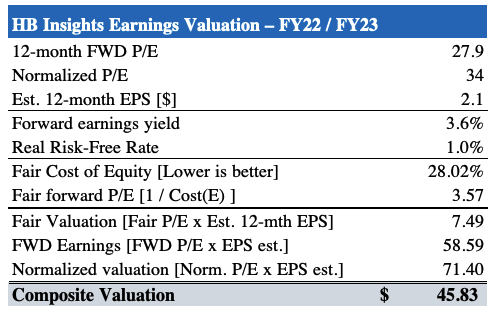
Data: HB Insights
The culmination of these points in mind, we rate GMED a buy for long-term value on a valuation of $110. There are a number of upside factors in the investment debate and it is very clear what we are buying into with GMED. We are buying a company with low intangible assets, quite a capital intense model that generates double-digit ROIC on a periodic basis. Rate buy Price target $110.