
Dilok Klaisataporn
Thesis
The stock market (bond market too) is going through extreme volatility lately due to a range of macroscopic risks, ranging from red-hot inflation to the Russian/Ukraine situation. As I am typing these lines, August CPI data just came out and turned out to be higher than anticipated. The YoY rise reached 8.3% compared to the anticipated 8.1%. The stock market responded with a roughly 5% decline for the NASDAQ 100 index and 4% decline for the S&P 500 index.
To put things into perspective, the chart below shows the top 20 largest daily declines in the S&P 500 dating back to 1923 when the index was first introduced. Note that these are the largest daily POINT losses by close price. A daily drop of 4% would translate to a loss of almost 180 points in the S&P 500. And such a loss would be the 5th largest daily drop since 1923! These days, the investment media tends to use the phrase “panic” a bit too liberally in my view and I certainly do not want to add to this abuse. But by any standard, I think it is fair to say that investors are panicking when the daily drop is within the top 20 (let alone the top 5) point losses in about 200 years.
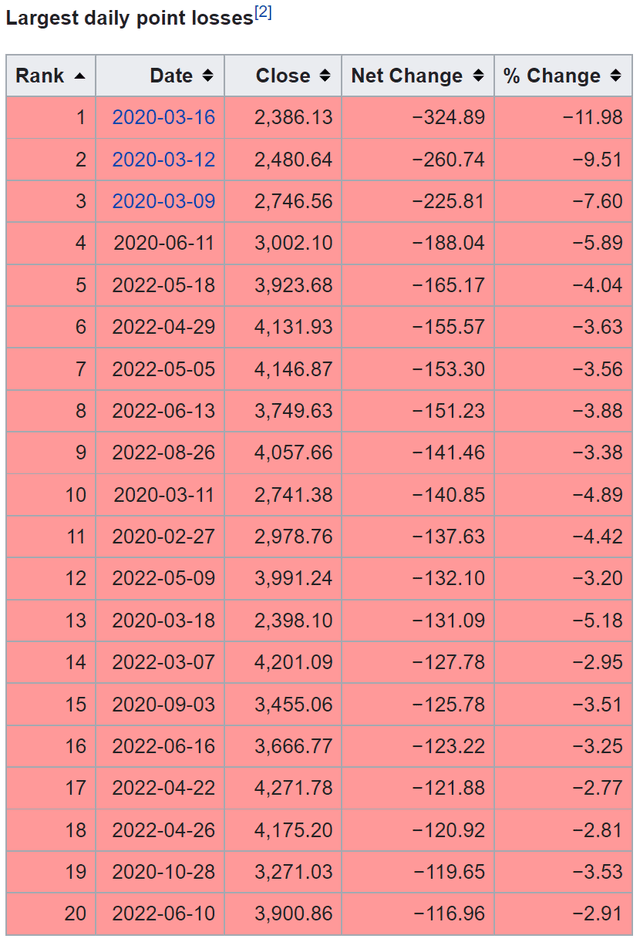
Source: en.wikipedia.org
What should we do? To start, we should NOT panic with the herd. Instead, we should stick to a disciplined approach and proven methods that we truly understand. And to me (a devout Buffett cultist), trying times like these are precisely the time to go back to basics, ignore the noises, and pick businesses with durable economic moats rather than temporary economic data.
The actions of the grandmaster himself probably speak louder than anything I can write here, especially with his Apple (NASDAQ:AAPL) position. You must already know that Buffett has been aggressively accumulating AAPL shares since 2016 in the Berkshire Hathaway (BRK.B) equity portfolio. And currently, AAPL is not only the largest position in the BRK equity portfolio but also an outsized position even considering his concentrated style. His APPL position is currently valued at around $122B at the current market prices, more than 40% of the equity portfolio and almost 20% of the total market cap of BRK. Even more tellingly, he has also kept adding shares recently amid all the macroeconomic uncertainties. As you can see, he has added 3.8M shares during 2022 Q1 and another 3.0M shares during 2022 Q2. These additions seem to be small potatoes (only about 0.43% of the existing position), but they are quite sizable in absolute terms and add up to more than $1B.
So why did he build such a large position and still keep adding to it? In the remainder of this article, I will argue that his entry decision back in 2016 is a classic example of buying a superb business at a price around 10x EBT (earnings before taxes). And at the current prices, it is admittedly far more expensive than 10xEBT. But you will see that its current valuation is still very reasonable considering its excellent perpetual growth prospects. And once you broader the view a bit more, you will see that it is still a far better choice than the overall market (and hence the majority of the stocks in the market).
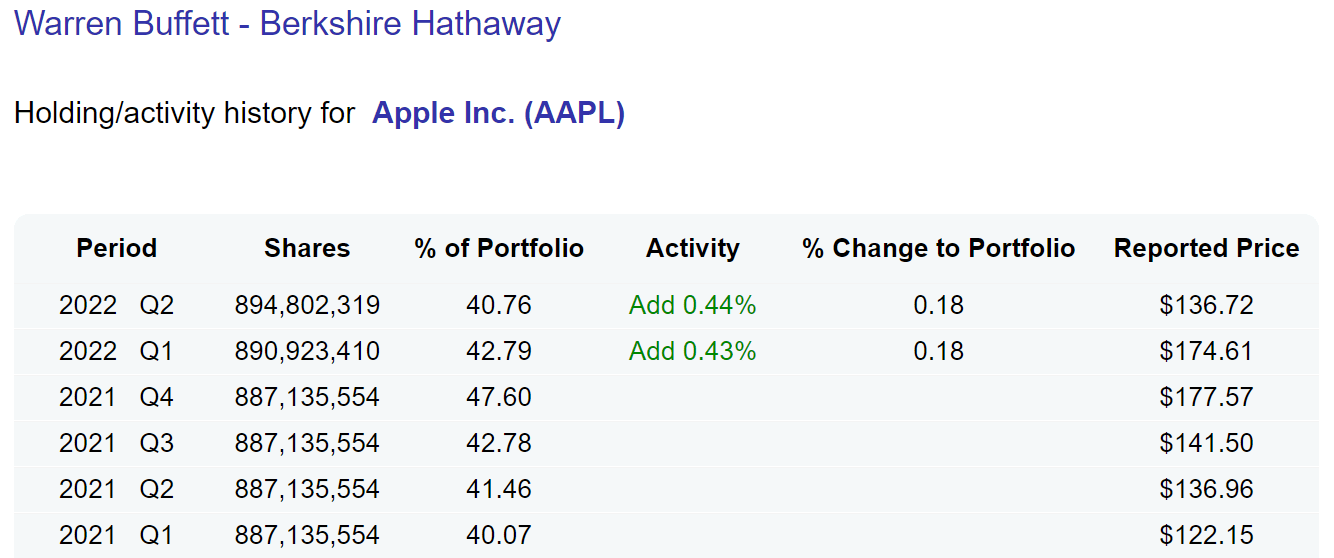
Source: DataRoma.com
Apple and Buffett’s 10x Pretax Rule
If you’re a devout Buffett cultist like this author, you must have noticed or heard that the grand master paid ~10x pretax earnings for many of his largest and best deals. The list is a really long one, ranging from Coca-Cola (KO), American Express (AXP), Wells Fargo (WFC), Walmart (WMT), Burlington Northern, and of course the more recent AAPL purchase and his recent $25B repurchases of BRK shares as analyzed in my earlier article. The following chart shows the historical prices of AAPL and its 10xEBT since 2010. As seen, Buffett made his major purchases during 2016-2017 when the price is below or near 10x EBT. He accumulated 229 million shares as of 2016 Q4 and then almost doubled his position to 517 million shares in 2017 Q1.
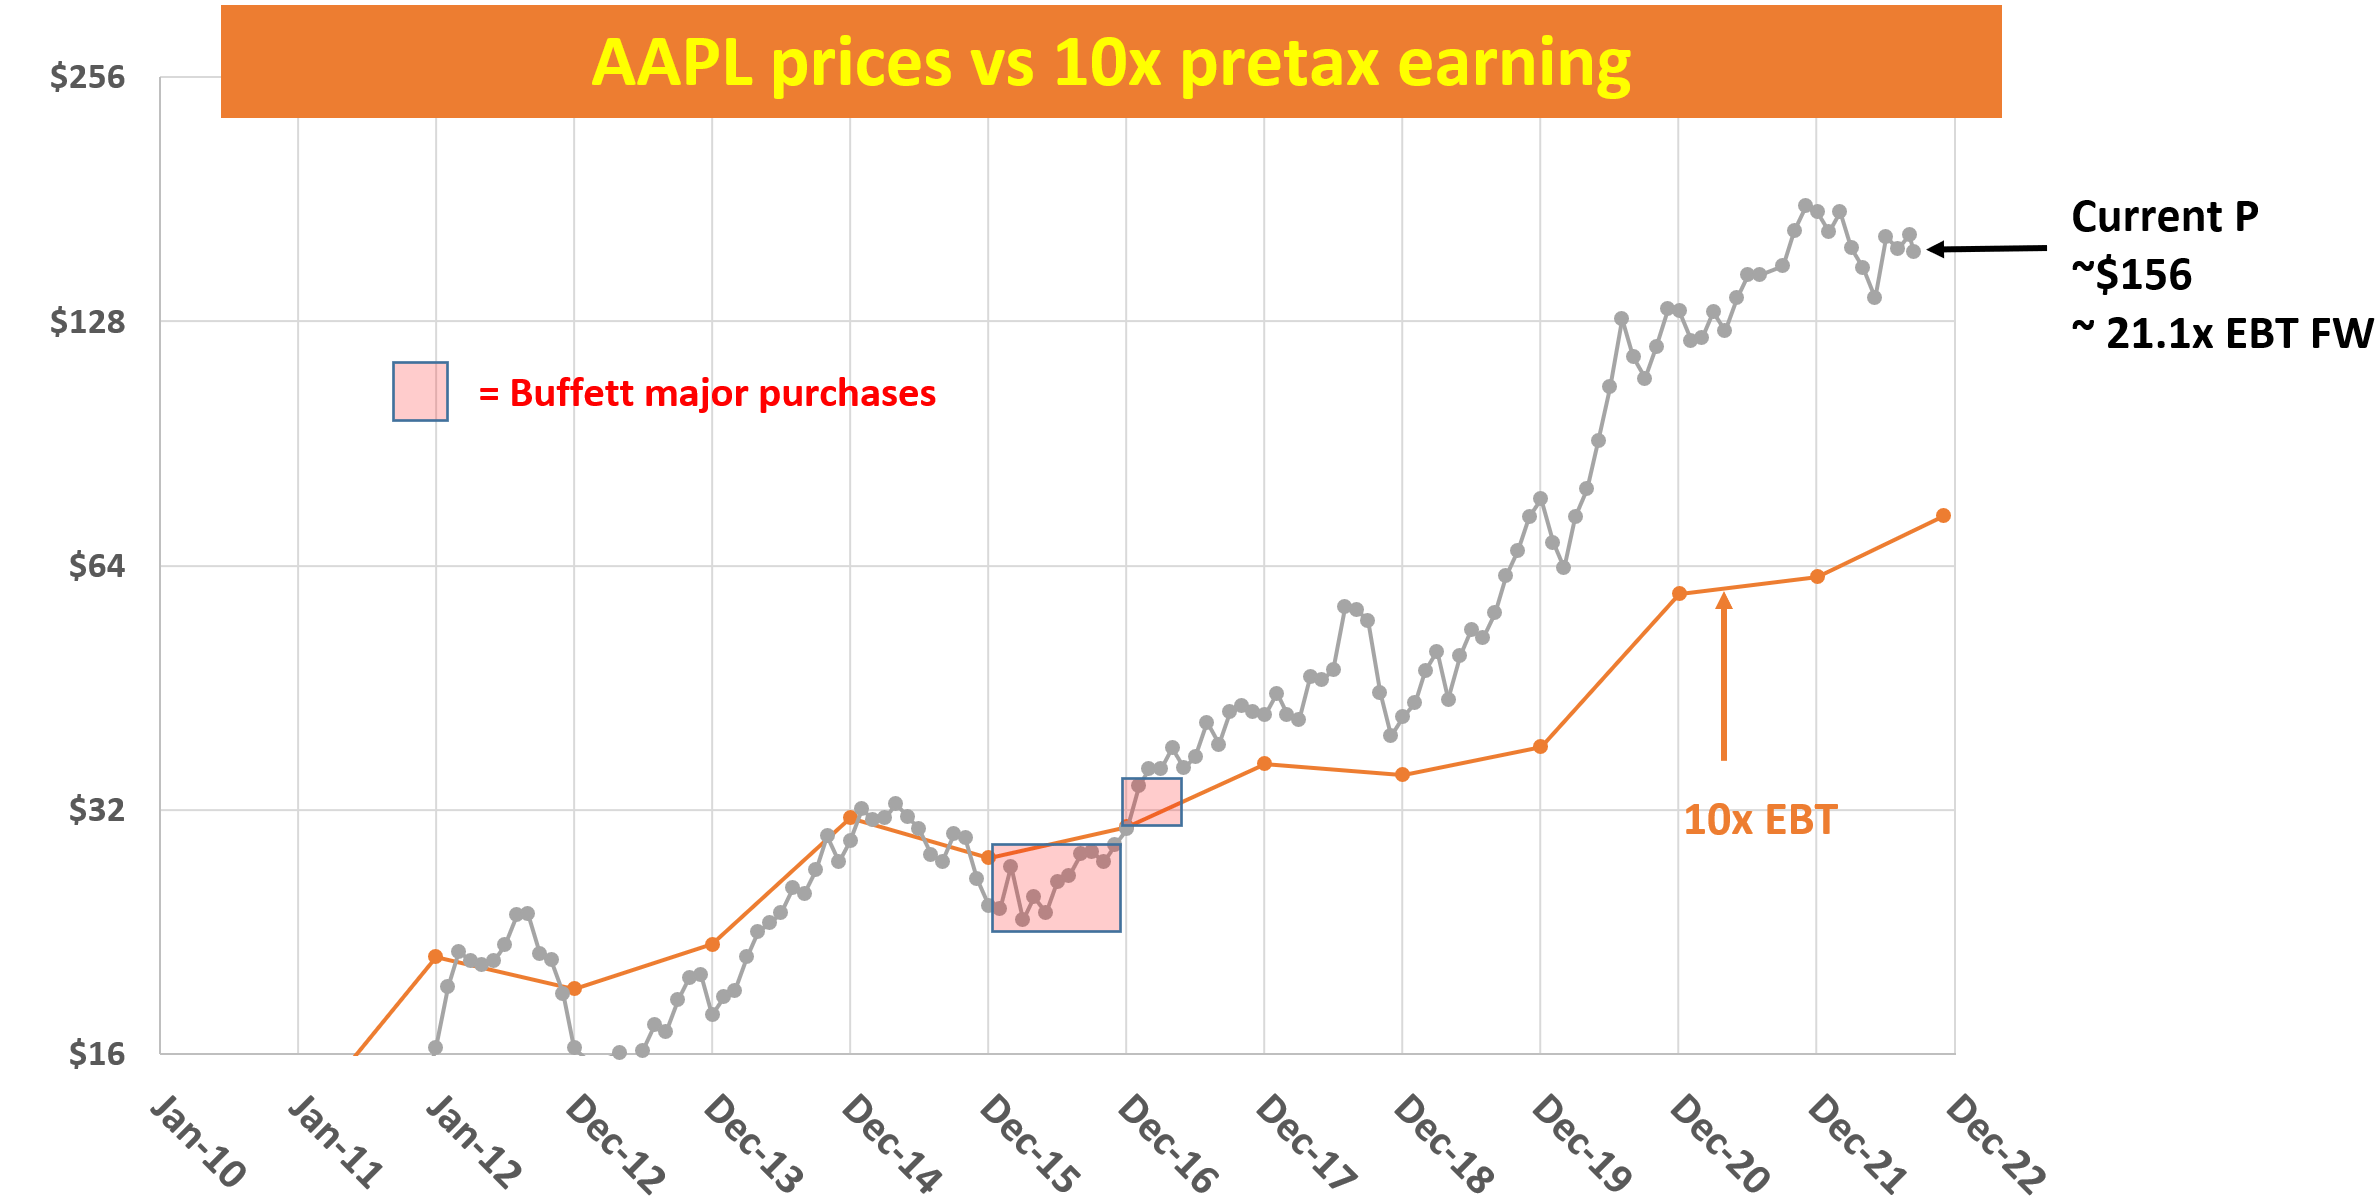
Source: Author based on Seeking Alpha data
In case you are new to Buffett’s 10x EBT rule, I have a blog article to provide all the details plus all the Q&A I’ve received. A quick summary is provided to facilitate the ease of reference:
- Buffett paid ~10x pretax earnings for many of his largest and best deals as aforementioned. It is hardly a coincidence because buying a business that stagnates forever at 10xEBT would already provide a 10% pretax earnings yield, directly comparable to a 10% yield bond. Any growth is a bonus.
- The 10xEBT rule does NOT mean you should go out and buy every/any stock that is priced below 10xEBT. Investors face two primary risks: A) quality risk or value trap, and B) valuation risk, i.e., paying too much. The 10x pretax rule is mainly to avoid the type B risk AFTER the type A risk has been eliminated already.
- Then how do we eliminate type A risks? I look for three things primarily. First and second, the business should have no existential issue in short term and the long term. And third, the business should have a decent chance to grow (at the so-call perpetual growth rate). This will be a plus.
AAPL in 2016 and 2017 obviously met all of the above requirements. It not only had no existential risks but was also demonstrating superb profitability (more on this later), and therefore a (or another) textbook example of Buffett’s 10xEBT rule.
AAPL stock: Why Buffett is still adding?
The next question now is: why does he still add to his AAPL position when its valuation is no longer 10x EBT? As a matter of fact, it is at about 21.1x FW EBT now at its price as of this writing. I am going to pretend that I know his thoughts. But in the remainder of the article, I will attempt to re-engineer his thinking process. And to me, the reasons mostly fall into the following three buckets, and I will elaborate on them one by one in the remainder of this article.
- AAPL’s economic moat is strong as ever and the macroeconomic uncertainties such as inflation or currency fluctuations are largely noise and temporary
- Its current valuation is still very reasonable considering its excellent perpetual growth prospects.
- And once you broaden the view a bit more, you will see that it is still a far better choice than the overall market (and hence the majority of the stocks in the market).
Apple’s strong economic moat
The most direct indicator of an economic moat is probably pricing power in the long term. And the following chart uses iPhone as an example to showcase AAPL’s pricing power. It is a busy chart with quite a bit of information (and has been detailed in my earlier article). The key takeaways are:
- Apple’s iPhone prices have skyrocketed over the past 14 years, iPhone 13 is 81% more expensive than the original iPhone. That is a 4.3% CAGR maintained over a 14-year period, far exceeding the inflation (about 2%) over the same period.
- Put in absolute terms, this means that an iPhone is on average US$437 more expensive now than in 2007. AAPL sold more than 234 million iPhones last year, and the $437 price hike translates to more than $100 billion of ADDITIONAL revenue.
- Again, the secret behind the pricing power is the wide moat created by the lover its users and highly innovative products – innovations that nobody asks for, but then everybody wants once they see.
The recently released iPhone 14 continues this trend. The iPhone 14 starts at $799 and the iPhone 14 Plus starts at $899. iPhone 14 Pro Max with 1TB storage starts at $1,599 before any accessories. And do not overlook the accessories. As an example, Apple removed the 3.5mm headphone jack back in 2016. So as a result, Apple users now have two options: either buy an Apple converter ($9) or buy the AirPods ($249). And this little removal helped AAPL to sell over 150 million units of AirPods thus far and raked in over $12 billion of revenue in 2021 alone. All told, there are 20+ Apple accessories and you need to spend more than $800 in the rare case that you want to buy all of them. And many of these accessories have gross profit margins as high as 90%.
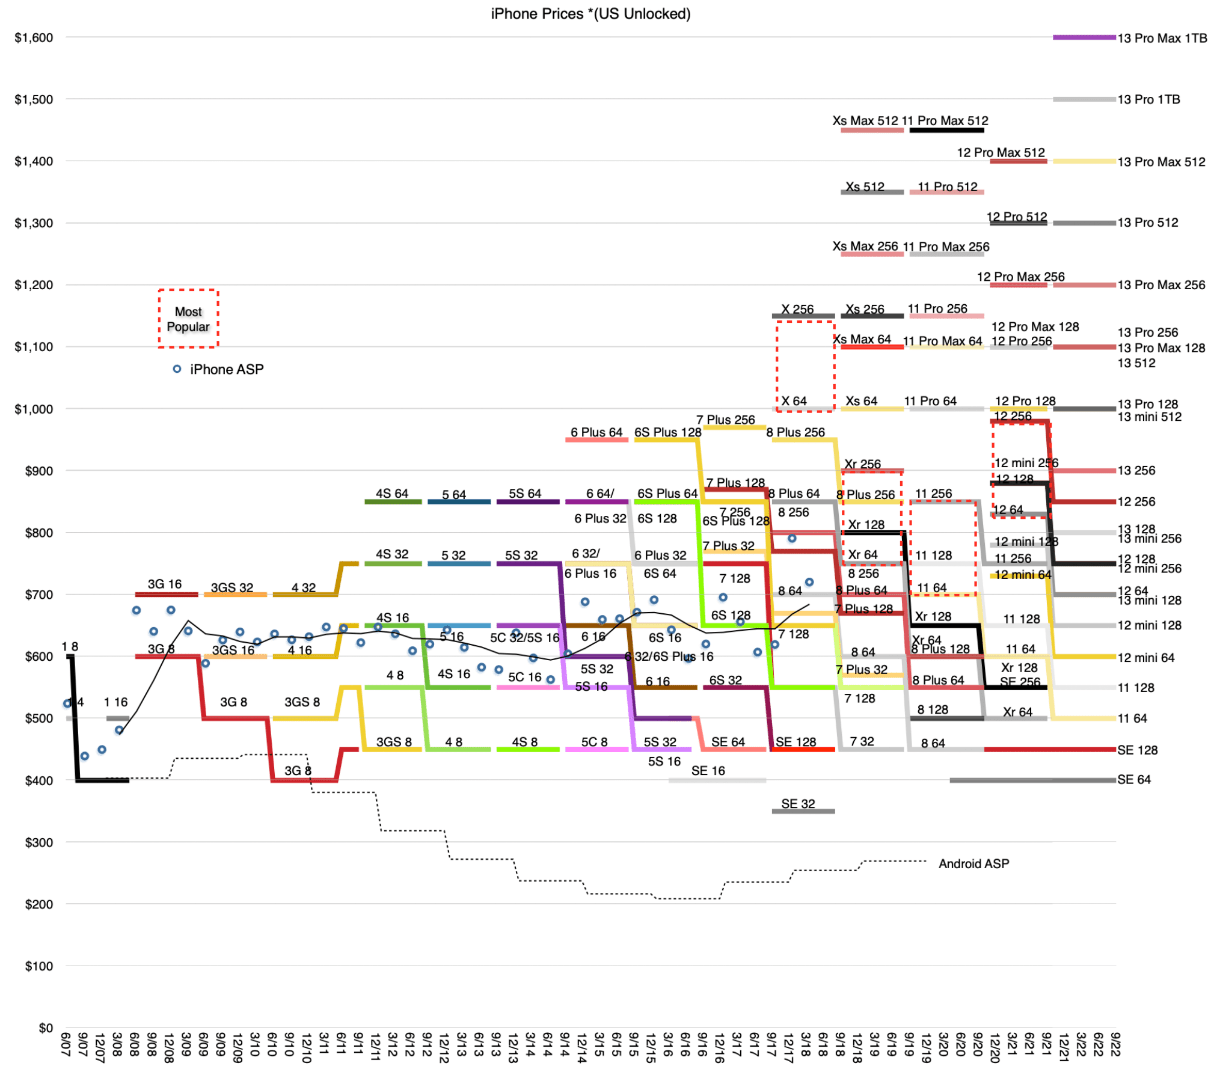
Source: GSMARENA
Perpetual growth prospects
The most important profitability metric in my opinion is ROCE (return on capital employed) because it measures the return of capital ACTUALLY employed in a business. Details of AAPL’s ROCE analysis have been provided in my early article already and here I will just directly quote the result.
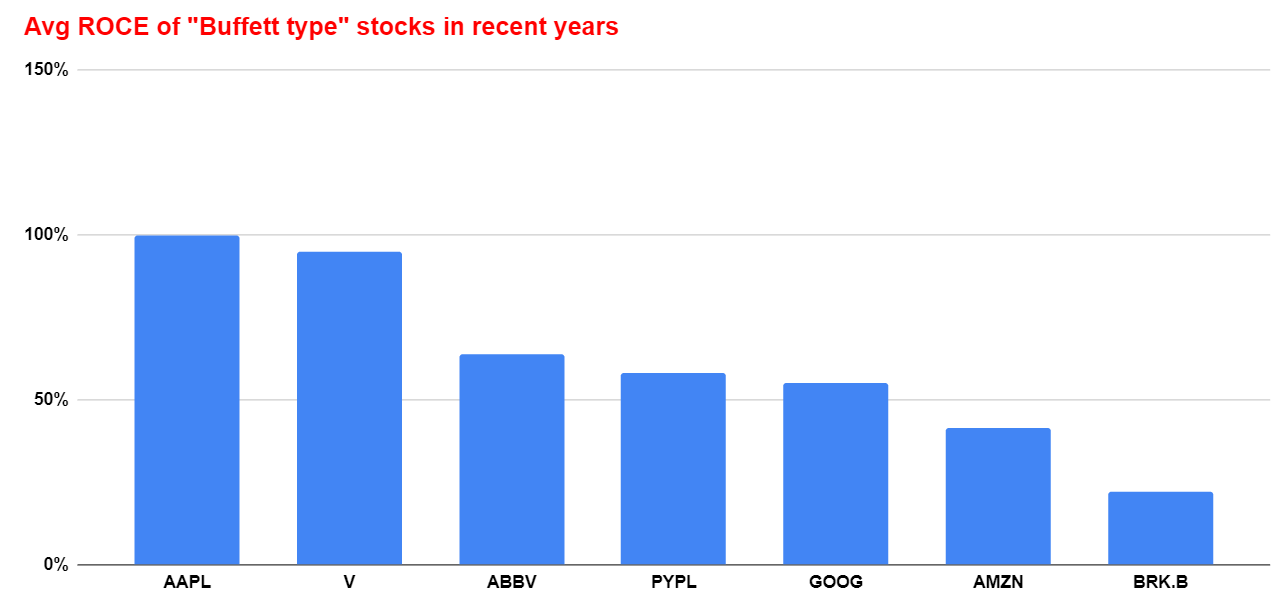
It maintains a remarkably high level of ROCE, on average about 100% in recent years. And this calculation considers the following items capital employed A) Working capital, including payables, receivables, and inventory, B) Gross Property, Plant, and Equipment, and C) Research and development expenses are also capitalized. The next chart helps to put things under perspective. You can see that AAPL’s ROCE is not only spectacular on an absolute basis, but it is also the highest among this group of overachievers.
Source: Author based on Seeking Alpha data
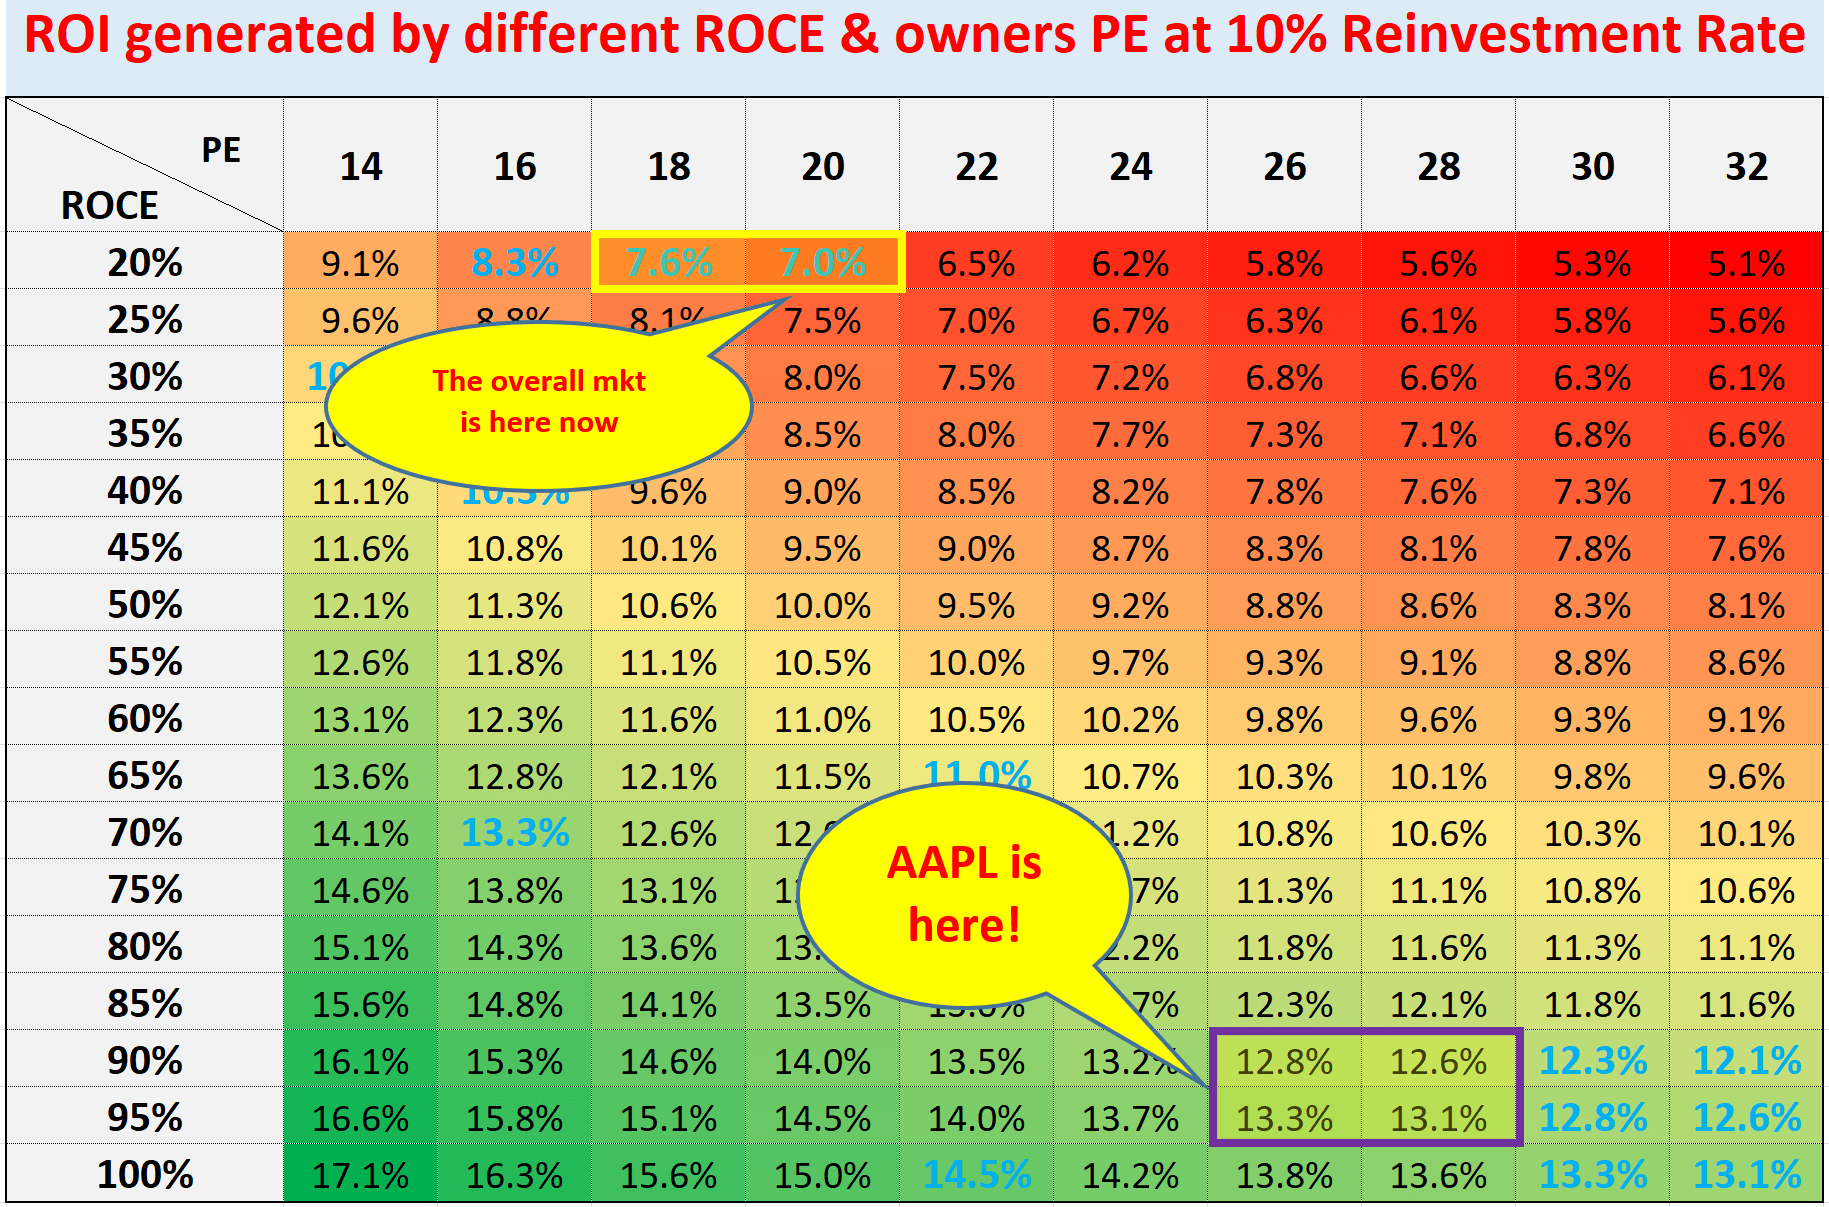
And when we think like a business owner, not a stock trader, the long-term return is simply determined by two things: A) the price paid to buy the business and B) the quality of the business. More specifically, part A is determined by the owner’s earning yield (“OEY”) when we purchased the business, and part B is determined by the product of ROCE and reinvestment rate. In AAPL’s case, it has been reinvesting “only” about 7.5% in recent years. So it could maintain a 7.5% long-term growth rate (ROCE * reinvestment rate = 100% * 7.5% = 7.5%). At its current valuation of 26.8x PE, the OEY is ~3.73%. The growth rate is about 7.5% as estimated above, resulting in more than 11.2% already.
In contrast, the overall market, represented by the S&P 500 index, is currently valued at about 18.4x PE, resulting in an OEY of about 5.4%. However, the overall market’s ROCE is on the order of 20% or so. And even with a 10% reinvestment rate, the growth rate would be about 2%, leading to a long-term ROI of about 7.4% per year.
Source: Author based on Seeking Alpha data
Final thoughts and risks
In terms of risks, I do not see any structural risks at this point, though there are plenty of near-term risks, such as inflation, cost/margin pressure due to high commodity prices, and shortage of silicon components. However, as aforementioned, I see these risks as only temporary. Also, the hotter-than-expected inflation data most likely will trigger further interest rate hikes, which in turn will further strengthen the dollar. All tech giants, AAPL included, have already reported strong currency headwinds in recent quarterly. AAPL has experienced about 3% currency headwinds in the past quarter. And a further strengthening of the dollar could exacerbate such current headwinds.
Finally, when we broaden our view even wider, you can see that AAPL’s current valuation is actually quite reasonable. It is a far cry from the top 10 percentile of the overall market as shown in the chart below. It is actually only around the media level (i.e., the 50 percentile line is shown in green), representing a large disconnection from its profitability and moat as detailed above. So to reiterate, during a market panic like what we are experiencing now, it is especially important to stick to sound investing principles and like those Buffett demonstrated with his AAPL shares. Do the things that are within your control (which include sticking with businesses with durable economic moats and being value-driven). And ignore the things that are totally unpredictable and/or out of anyone’s control (like most of the macroeconomic parameters).

Source: Author based on Seeking Alpha data