
piranka
Analysis of Previous Forecast
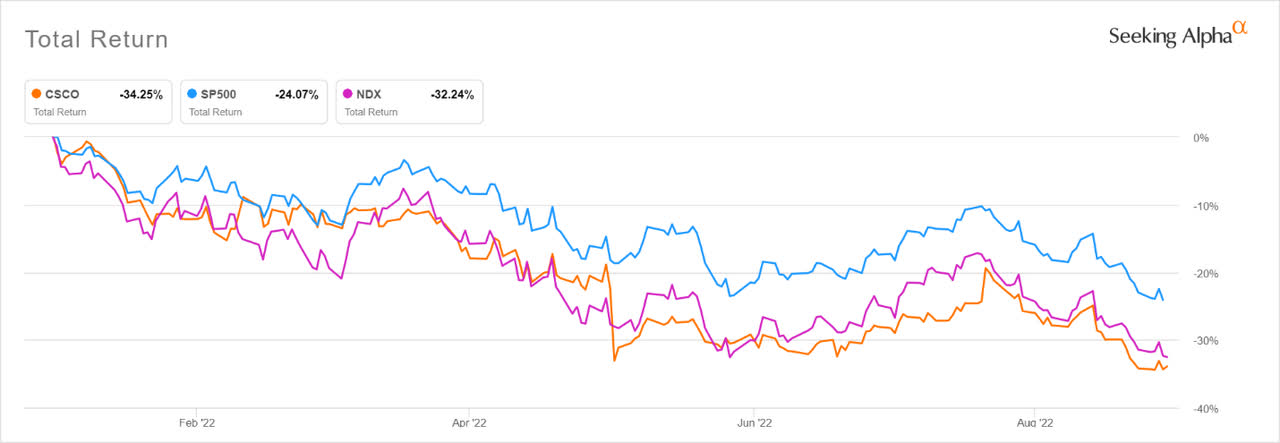
Since my last article and the beginning of the year, Cisco (NASDAQ:CSCO) has underperformed both the S&P 500 and the Nasdaq 100.
Seeking Alpha
Total return is close to my forecast Minimum scenario of -34%. Three key inputs were used to derive the total return forecast: revenue growth, gross margin, and multiple expansion.
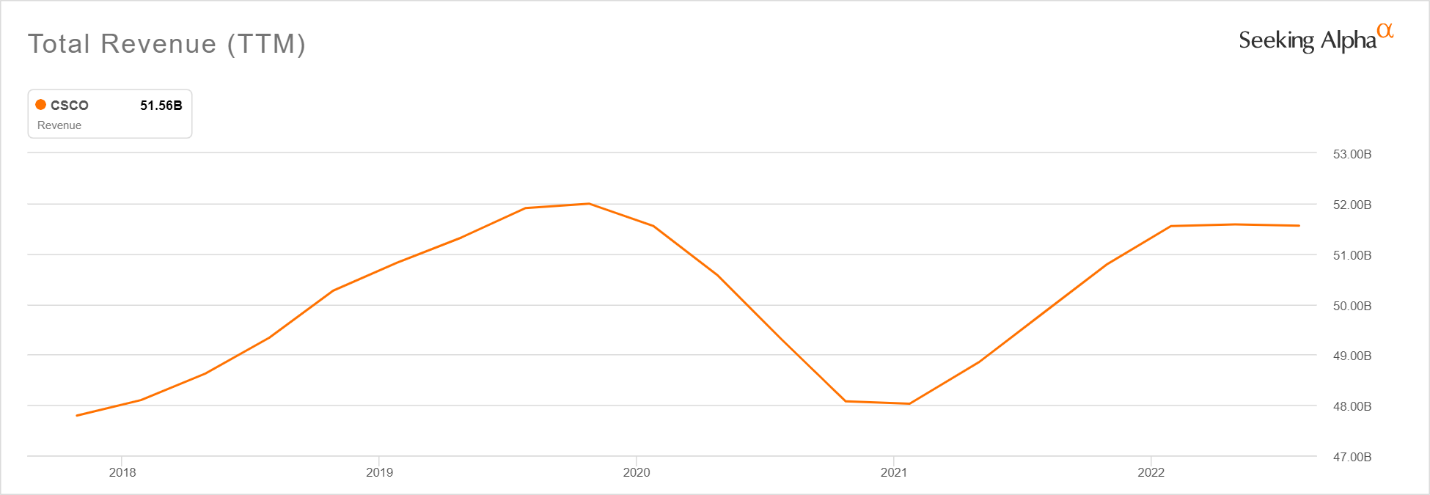
Fiscal 2022 revenue growth of 3% was between the Minimum (0th percentile) and Worst Case (10th percentile) scenarios for the same reason specified for the Minimum: “Supply constraints or COVID cause 0% growth.” Supply was constrained due to Covid lockdowns in China.
Seeking Alpha
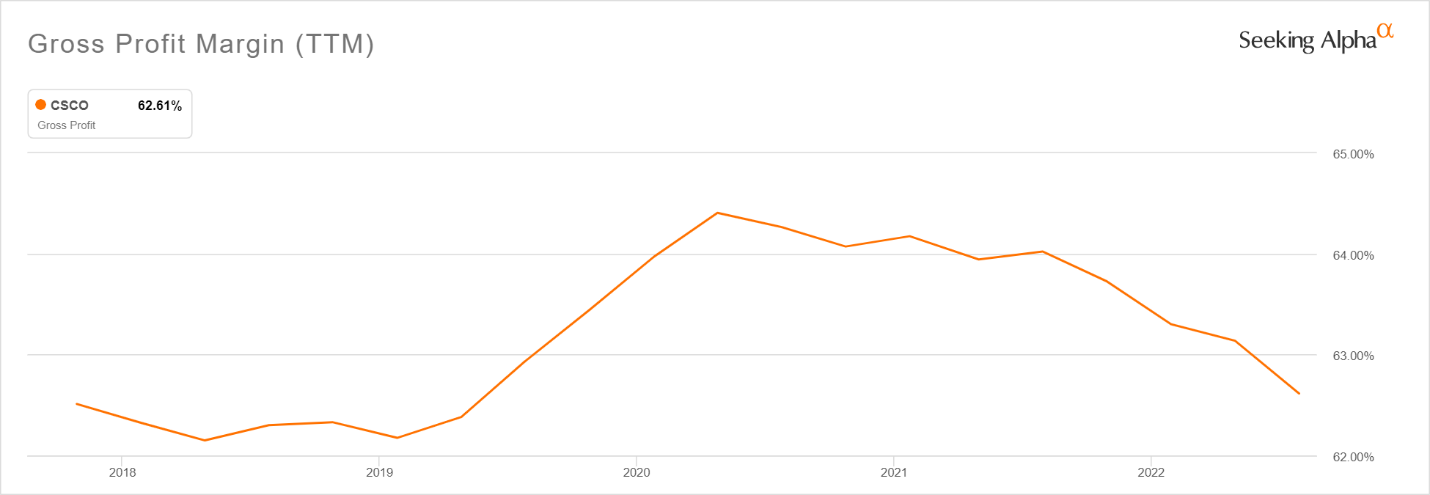
Fiscal 2022 gross margin of 62.5% was slightly worse than the forecast Worst Case (10th percentile) scenario of 63%.
Seeking Alpha
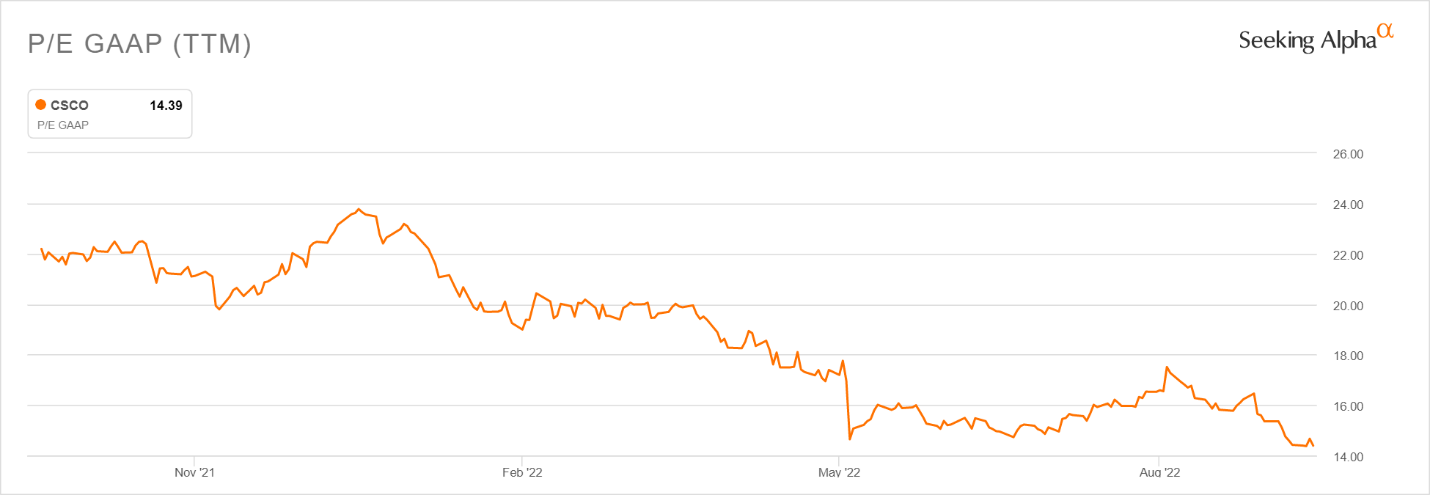
Price-to-earnings contracted to ~14 and was near the forecast Minimum scenario of -30% contraction.
Seeking Alpha
As a result, enterprise value is now approaching 5-year lows:
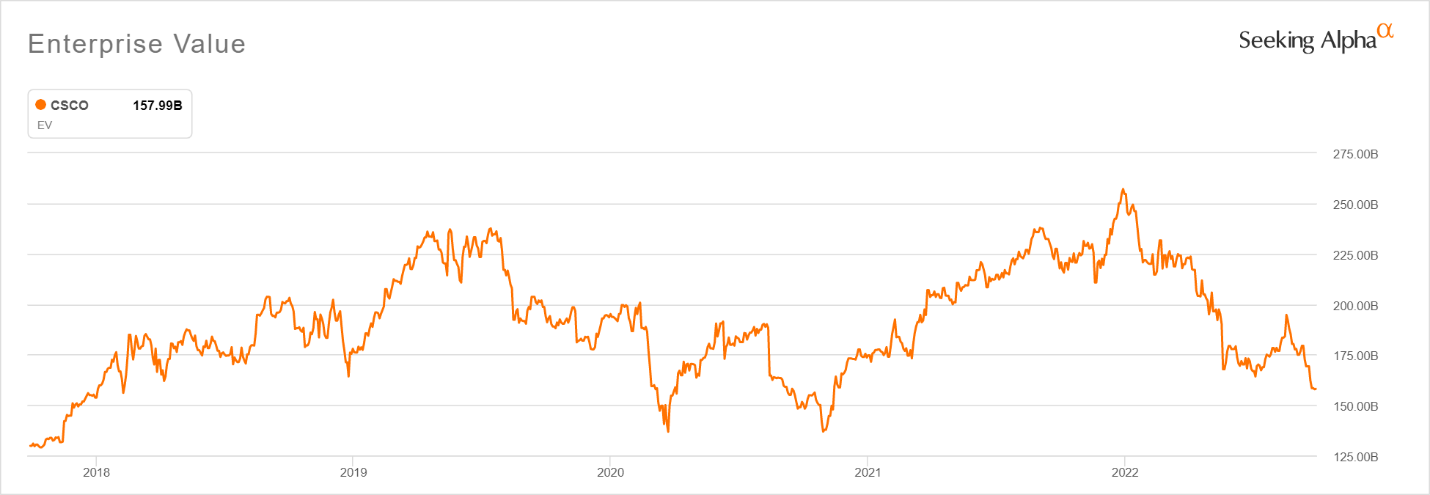
Seeking Alpha
Latest Results
According to the 2022 Q4 Earnings Presentation, Cisco’s backlog is at a record high even though Q4 order growth declined 6% year-over-year. As was true last year, both Current and Non-Current Unearned Revenue have continued to trend upwards.
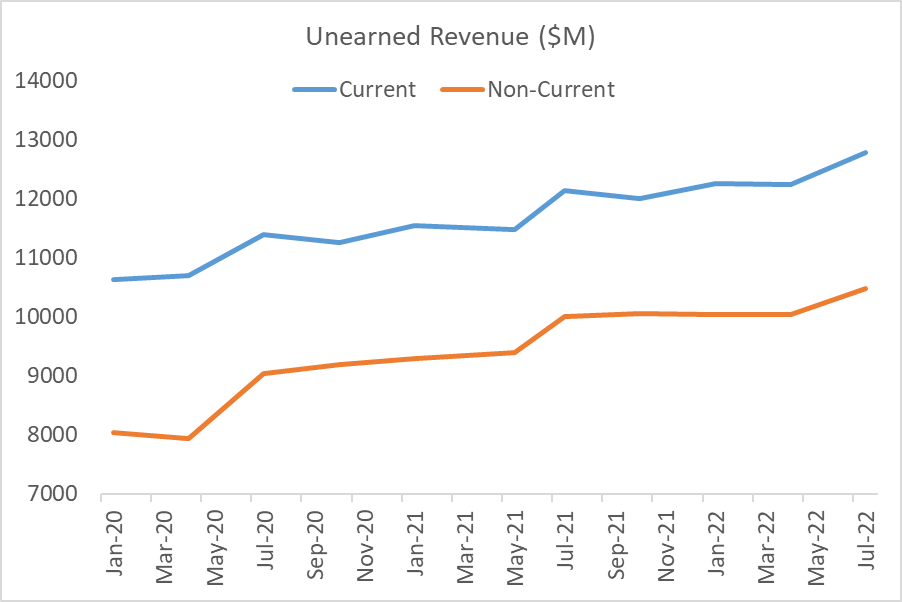
Seeking Alpha and Poppertech
According to the 2022 Q4 Earnings call, web scale orders grew 50% on a trailing four quarter basis and the 8000 series routers, based on the Silicon One architecture, is the fastest growing platform in company history.
Based on the current market capitalization, Cisco’s 2022 earnings yield was 7%. Cash returned to equity holders via dividends and share repurchases yielded 8.6%. In addition, the company paid down long-term debt by $2 billion, and it is now less than $10 billion or ~5% of enterprise value. Even if the company were to miss its guidance again and perform at similar levels to last year, the cash returned to shareholders still should be significant.
Key Inputs
The three inputs to the valuation are: revenue growth, gross margin, and multiple expansion. These parameters are estimated for five different scenarios: Minimum (0th percentile), Worst Case (10th percentile), Most Likely, Best Case (90th percentile), and Maximum (100th percentile). Historical data, current data, management estimates, and best guesses underlie the following assumptions:
Revenue Growth: Base case matches bottom of 4-6% FY 2022 guidance
- Minimum: Supply constraints or a recession cause -5% growth, or 9% below base
- Worst Case: Supply constraints or a recession cause 0%, or 4% below base
- Most Likely: Matches base case of 4%
- Best Case: Matches high side of guidance of 6%, or 2% above base
- Maximum: Matches high side of guidance and shrinks backlog yielding 7% growth, or 3% above base
Gross Margin: Base case matches current gross margin of 62.5%
- Minimum: Supply constraints or a recession cause margin to fall 3%
- Worst Case: Matches 2021 decline of 1.5%
- Most Likely: Matches base case
- Base Case: Matches 2021 margin of 64%, or 1.5% increase
- Maximum: Matches highest margin of 64.5%, or 2% increase 2022
Price-to-Earnings: Base case matches current value of 14
- Minimum: 10, or 29% contraction
- Worst Case: 12, or 14% contraction
- Most Likely: 14 or stable
- Best Case: 18, or 28% expansion
- Maximum: 24, or 71% expansion
The base case annual total return is assumed to be the dividend yield, or 4%. For the other scenarios, the assumptions are combined to calculate the following estimates of total return.
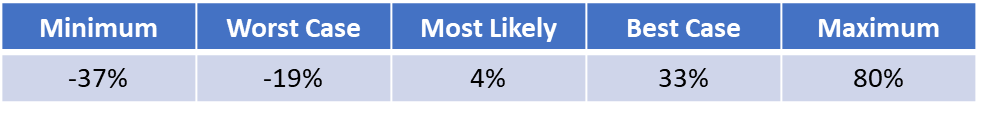
Poppertech
To create the forecast, the above scenarios are input into software that creates the graph below and associated statistics. The black values underneath the graph indicate the total return values as shown in the previous table of scenarios. The white percentage values overlaid on the graph correspond to the proportion of the total area under the curve within each colored region. This is the forecast probability of the total return falling within the associated range. For example, the light green region represents a 40% chance that total return is between 4% and 33% over the next year.
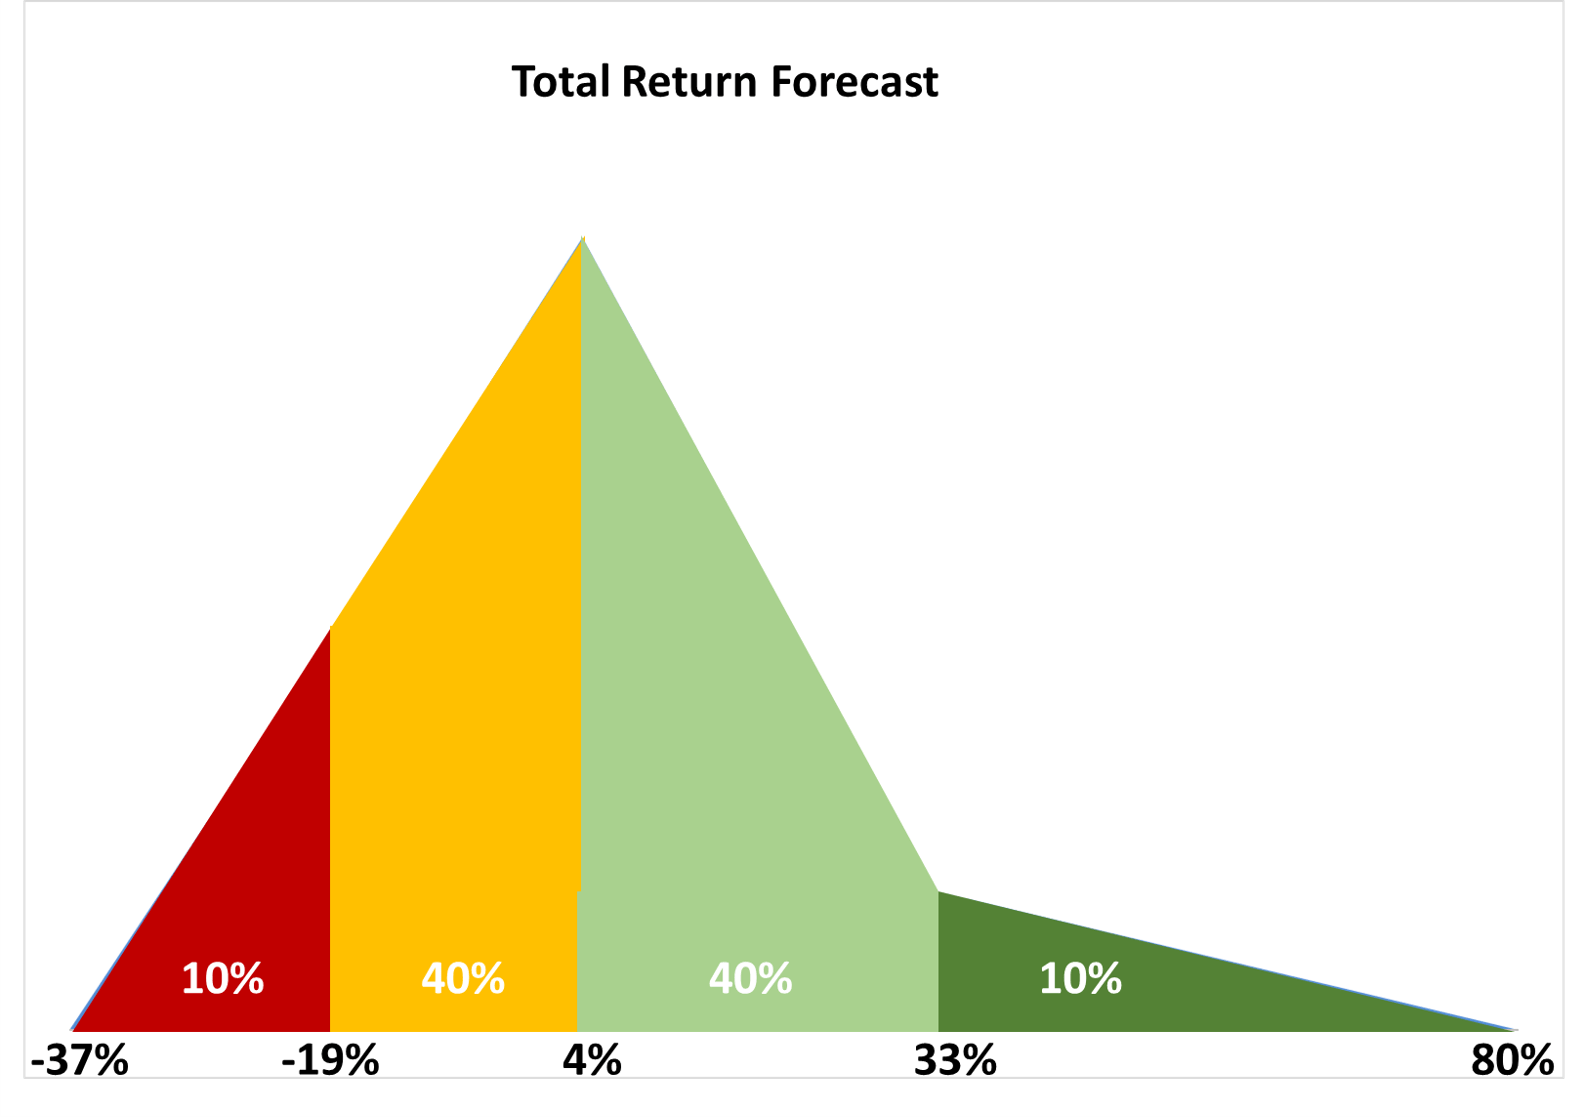
Poppertech
Based on the above forecast, the software performs a Monte Carlo analysis to calculate expected return and risk. The resulting statistics are shown below.
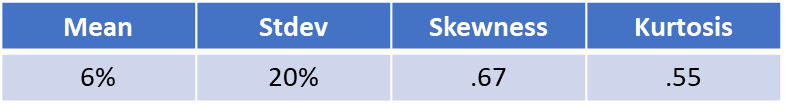
Poppertech
At an expected return of 6%, relatively low risk, and asymmetrically positive risk-return profile (positive skewness), Cisco is a buy. The company is conservatively financed and performance has been historically hampered by company-specific execution issues. If these are resolved this year, Cisco is likely to outperform the market by a wide margin.