
Justin Sullivan
The Chart of the Day belongs to the regulated utility PG&E (PCG). I found the stock by sorting Barchart’s Top Stocks to Own list of highest Barchart opinion first by the closest to its 52-week high, then used the Flipchart feature to review the charts for consistent price appreciation. Since the Trend Spotter signaled a buy on 10/3, the stock gained 6.52%.
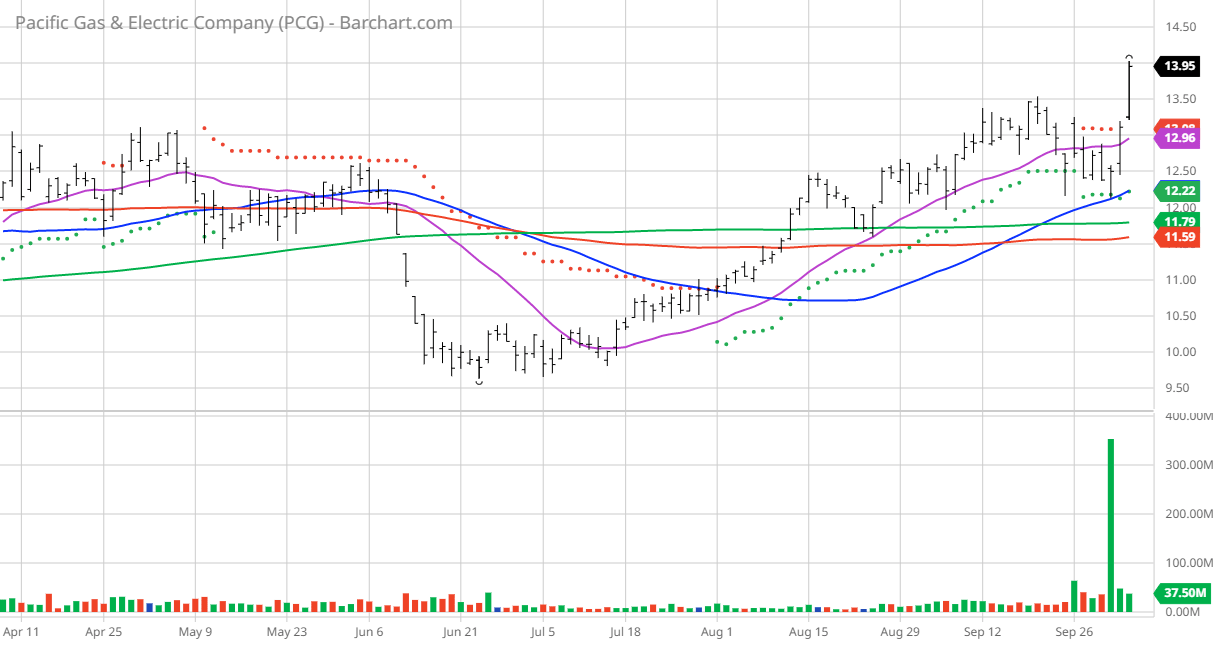
PCG Price vs Daily Moving Averages
PG&E Corporation, through its subsidiary, Pacific Gas and Electric Company, engages in the sale and delivery of electricity and natural gas to customers in northern and central California, the United States. It generates electricity using nuclear, hydroelectric, fossil fuel-fired, fuel cell, and photovoltaic sources. As of December 31, 2021, the company owns and operates approximately 18,000 circuit miles of interconnected transmission lines; 33 electric transmission substations, approximately 108,000 circuit miles of distribution lines, 67 transmission switching substations, and 753 distribution substations; and natural gas transmission, storage, and distribution system consisting of approximately 43,800 miles of distribution pipelines, approximately 6,200 miles of backbone and local transmission pipelines, and various storage facilities. It serves residential, commercial, industrial, and agricultural customers, as well as natural gas-fired electric generation facilities. The company was incorporated in 1905 and is headquartered in San Francisco, California.
Barchart’s Opinion Trading systems are listed below. Please note that the Barchart Opinion indicators are updated live during the session every 20 minutes and can therefore change during the day as the market fluctuates. The indicator numbers shown below therefore may not match what you see live on the Barchart.com website when you read this report.
Barchart Technical Indicators:
- 88% technical buy signals but increasing
- 34.60+ Weighted Alpha
- 42.41% gain in the last year
- Trend Spotter buy signal
- Above its 20-, 50- and 100-day moving averages
- 7 new highs and up 11.43% in the last month
- Relative Strength Index 66.90%
- Technical support level at 12.65
- Recently traded at $13.99 with 50-day moving average of $12.23
Fundamental factors:
- Market Cap $32.32 billion
- Revenue expected to increase 8.60% this year and another 4.60% next year
- Earnings estimated to increase of 1.90% this year, an additional 11.80% next year and continue to compound at an annual rate of 4.59% for the next 5 years
Analysts and Investor Sentiment – I don’t buy stocks because everyone else is buying but I do realize that if major firms and investors are dumping a stock it’s hard to make money swimming against the tide:
- Wall Street analysts have 1 strong buy, 7 buy and 6 hold opinion on the stock
- Analysts price targets from $12.50 to $19.00 with an average of $16.14
- The individual investors following the stock on Motley Fool agree and voted 289 to 33 that the stock will beat the market and the more experienced investors vote for the same results with a 46 to 10 vote
- 26,470 investors are monitoring the stock on Seeking Alpha
Ratings Summary
Factor Grades
Quant Ranking?
Sector
Industry
Ranked Overall
Ranked in Sector
Ranked in Industry
Quant ratings beat the market »