
MicroStockHub
Thesis and the 2022 CHIPs Act
On August 9, President Biden signed the 2022 CHIPS act into law. As detailed in my earlier articles, the passing of the act signals that:
Both the U.S. and China now recognize the competition in the chip space is not only a matter of business and profits but also a crucial matter of national security. Under the heightened tension, the CHIPS Act aims to bring semiconductor manufacturing and research back to the U.S. and also to reduce U.S. dependence on China and Taiwan.
Under this broader context, this article will analyze the impact of the CHIPS act on a domestic chip stock, Texas Instruments (NASDAQ:TXN), and a foreign one, Taiwan Semiconductor Manufacturing (NYSE:TSM). The thesis is really simple – investors should not fight the macro forces ahead and should invest in domestic chip stocks like TXN.
Despite its cheap valuation (9.6x FW PE vs. TXN’s 16.9x), TSM is at the crossfire of multiple geopolitical forces and faces a very uncertain future. And my view is that such a valuation discount still does not compensate for these risks properly. I anticipate the CHIPS act to provide a strong tailwind for TXN for years or even decades to come. While at the same time, TSM will be fighting against mega forces. And President Xi Jinping’s reelection for a 3rd term is likely to further heighten these forces for TSM. As a notable example, shortly after Xi’s reelection, Bloomberg reported that:
TSM had suspended work for Chinese startup Biren Technology as it seeks to determine whether the company is in the crosshairs of the Biden Administration’s new controls on the Chinese semiconductor industry.
I expect such friction to be the new norm for TSM in the years to come, while TXN will be a major beneficiary of the CHIPs act. TXN recently broke ground on 4 new 300-millimeter semiconductor fabrication plants. These plants have a combined price tag of over $30 billion, and I anticipate the CHIPs Act to shave hundreds of millions if not billions of dollars off of the project’s estimated cost. Besides such direct subsidies on capital expenditures, TXN will also receive support from the act indirectly via tax credits and fundamental research supported by the act.
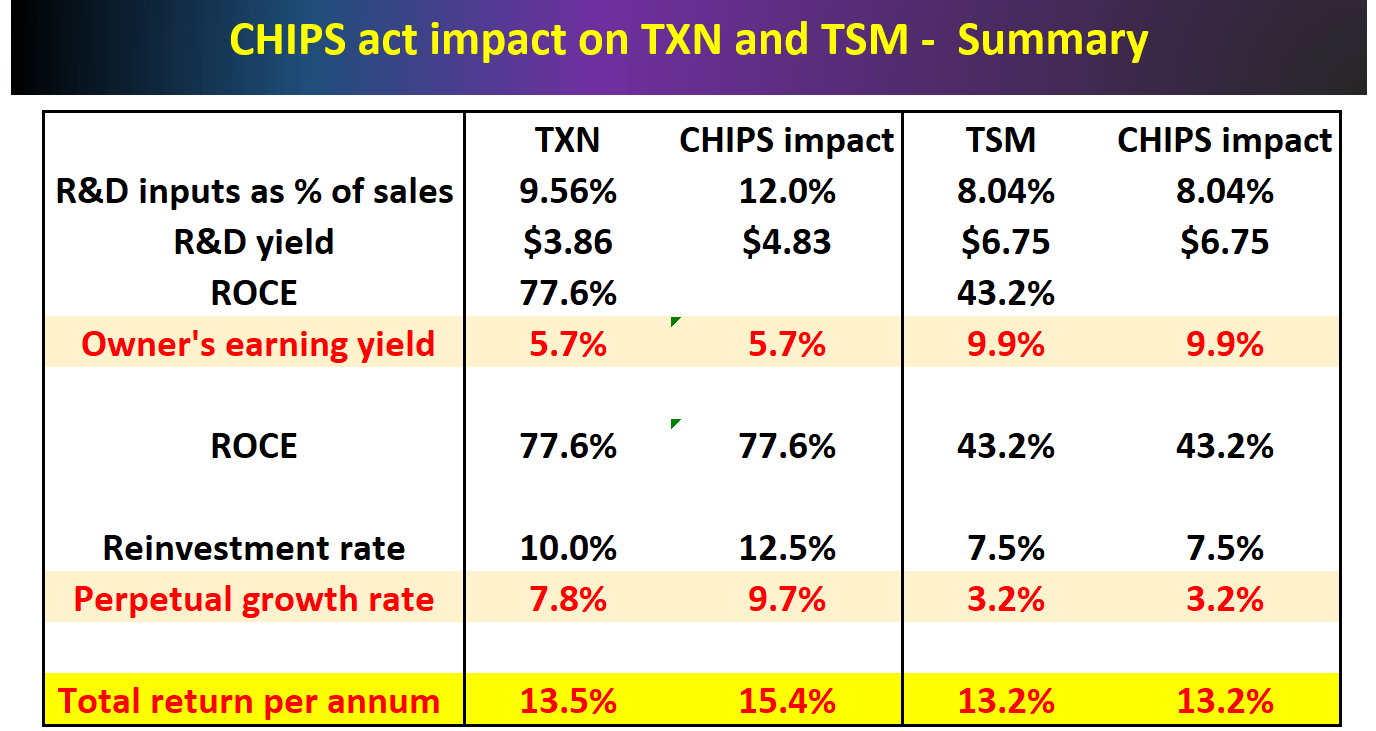
All told, the table below highlights the potential impact of the act on TXN and the lack of benefit for TSM. The remainder of this article will essentially go over my analysis summarized in this table in more detail. And the bottom line is that, as you can see from the table, even before the CHIPS act’s impacts are considered, TXN is already providing total return potential on par with TSM (13.5% versus 13.2%). Once the CHIPS act’s impacts are considered, TXN’s total return potential would be boosted to 15.4% per year, while TSM’s total return potential would largely remain unchanged at 13.2%. In other words, as just mentioned, TSM’s valuation discount is not large enough to compensate for the risks ahead.
Source: Author based on Seeking Alpha data
TXN and TSM: Research and Development Benefits
The first way the CHIPS act could help TXN but not TSM’s R&D expenses. So, let’s first see the R&D expenditures of TXN and TSM so we can estimate the impact of the act on this front.
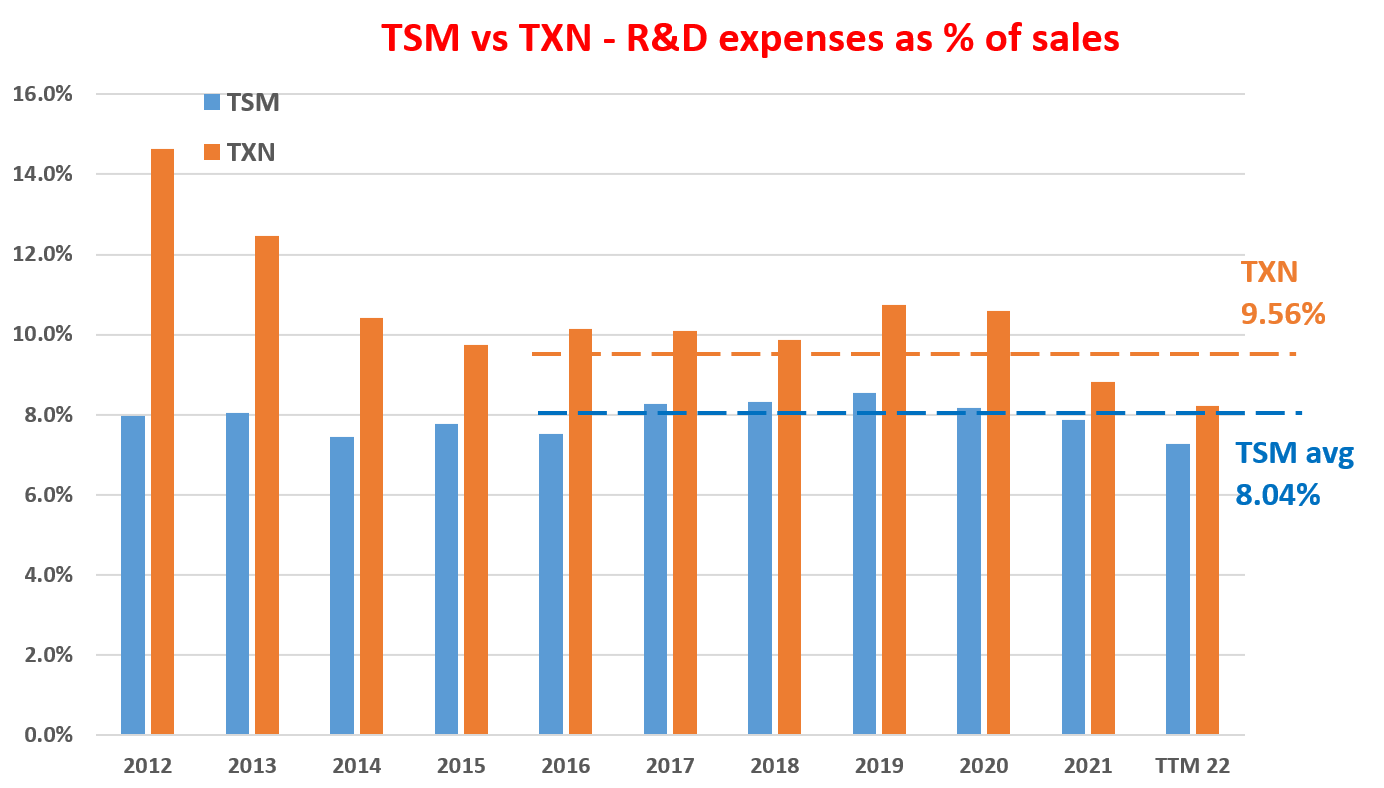
The next chart shows the R&D expenses of TXN and TSM as a percentage of their total revenues over the past decade. As seen, both have been consistently investing in R&D. However, TXN has been investing more heavily. On average, it has been spending about 9.56% of its total sales on R&D. In contrast, TSM has been spending about 8.04% of its sales on R&D. In absolute dollar amount, TXN spent $1.65B as of TTM 2022 on R&D.
The CHIPS act includes a budget of $200 billion for research grants. Therefore, the act provides more than decades worth of TXN’s R&D budget. The grants will be used to sponsor fundamental research in U.S. universities and labs, indirectly helping U.S. chip stocks such as TXN. And we will further quantify the impact next.
Source: Author based on Seeking Alpha data
Boost to TXN’s R&D yield
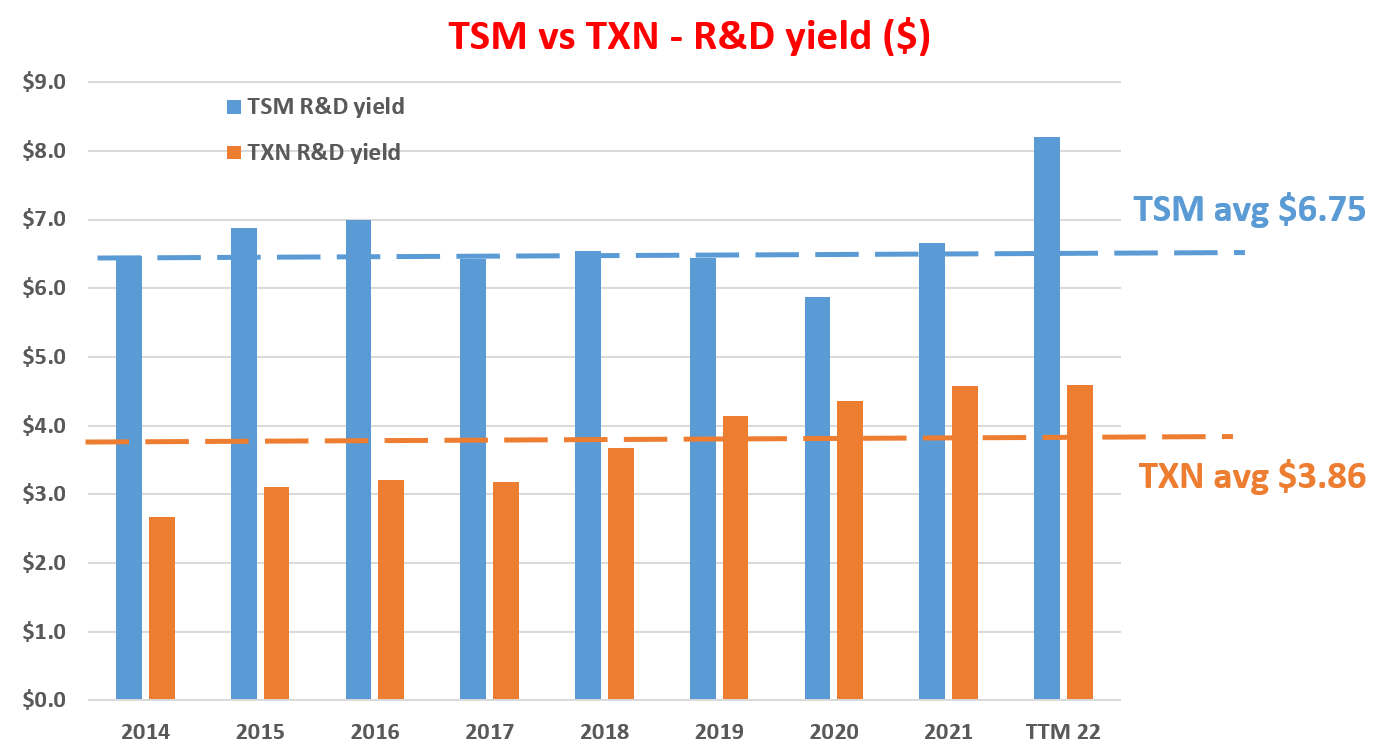
Here we will use a variation of Buffett’s $1 test on R&D expenses to assess the CHIPS act’s impact. The method is detailed in our earlier articles. As you can see, the R&D yield for TXN has been healthy with a long-term average of $3.86 over the past 10 years. And the R&D yield for TSM is simply superb, with an average of $6.75 over the same period. To put things under perspective, Apple (AAPL) boasts the highest R&D yield among the FAAMG stocks, and its R&D yield is “only” $4.70, still a far cry from TSM’s.
Source: Author based on Seeking Alpha data
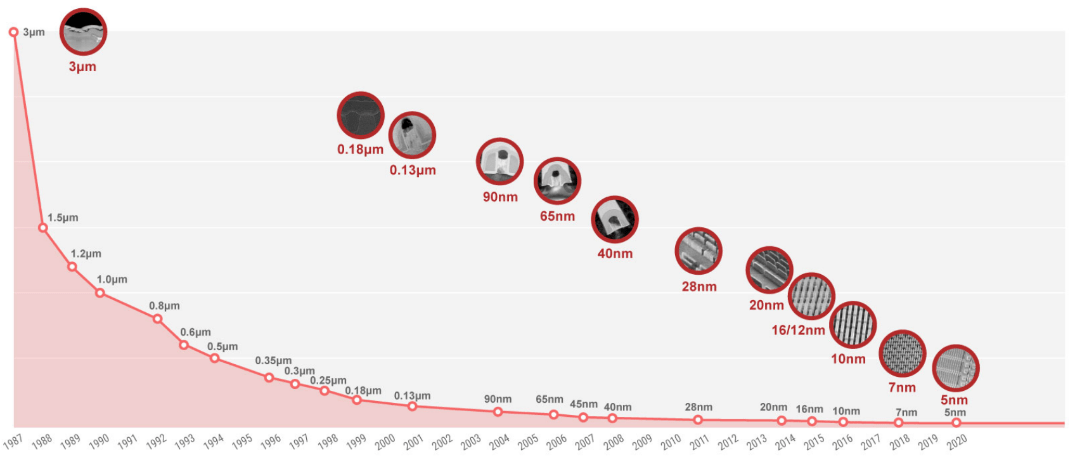
Of course, TSM’s superb R&D yield is supported by strong business fundamentals such as its manufacturing-only model and its technological lead. As seen in the chart below, TSM has already matured the 7 nm technology back in 2018, way ahead of other chip players such as TXN or Intel (INTC). However, I see the CHIPS act as the pivotal point. It levels, or even tilts, the playground for U.S. players to narrow the gap and catch up.
Now back to R&D yield, with the tax credit and research grants provided in the CHIPS act, I am modeling TXN’s R&D yield to be boosted by at least 25%. That is why you see its R&D yields boosted from $3.86 to $4.83 because of the CHIPS act. Admittedly, $4.83 is still lower than TSM’s $6.75 (assuming it can maintain such a yield – a big assumption the way I see it). But a $4.83 R&D yield is superb even when compared to AAPL as aforementioned.
Source: TSMC.com
TXN and TSM: capital expenditures and ROCE
The second way that TXN can benefit from the CHIPS act is obviously the subsidies it expects to receive on its capital projects. As mentioned earlier, I anticipate TXN to receive millions if not billions of dollars for its 4 semiconductor fab plants ongoing in Texas. Such subsidies will cause TXN’s free cash flow to expand and in turn, boost its profitability. Admittedly, TSM could receive some subsidies from the CHIPS act too for its capital projects. It’s building a $12 billion fab facility in Arizona, which could receive some subsidies from the act too. However, I anticipate its AZ plant (together with other overseas players) to be at a lower priority to be subsidized by the act. And for whatever benefits it does end up receiving, I anticipate the benefits to be countered by the many geopolitical headwinds aforementioned.
To further quantify the impacts, I will rely on a key profitability metric: ROCE (return on capital employed). It is detailed in our earlier articles and a brief recap is provided below:
When we think of long-term growth (like in 10 years or more), the growth rate is “simply” the product of ROCE and reinvestment rate, i.e.,
Long-Term Growth Rate = ROCE * Reinvestment Rate
ROCE is the most important metric for measuring profitability because it considers the return of capital ACTUALLY employed. In this analysis, I consider the following items capital actually employed A) Working capital (including payables, receivables, inventory), B) Gross Property, Plant, and Equipment, and C) Research and development expenses are also capitalized.
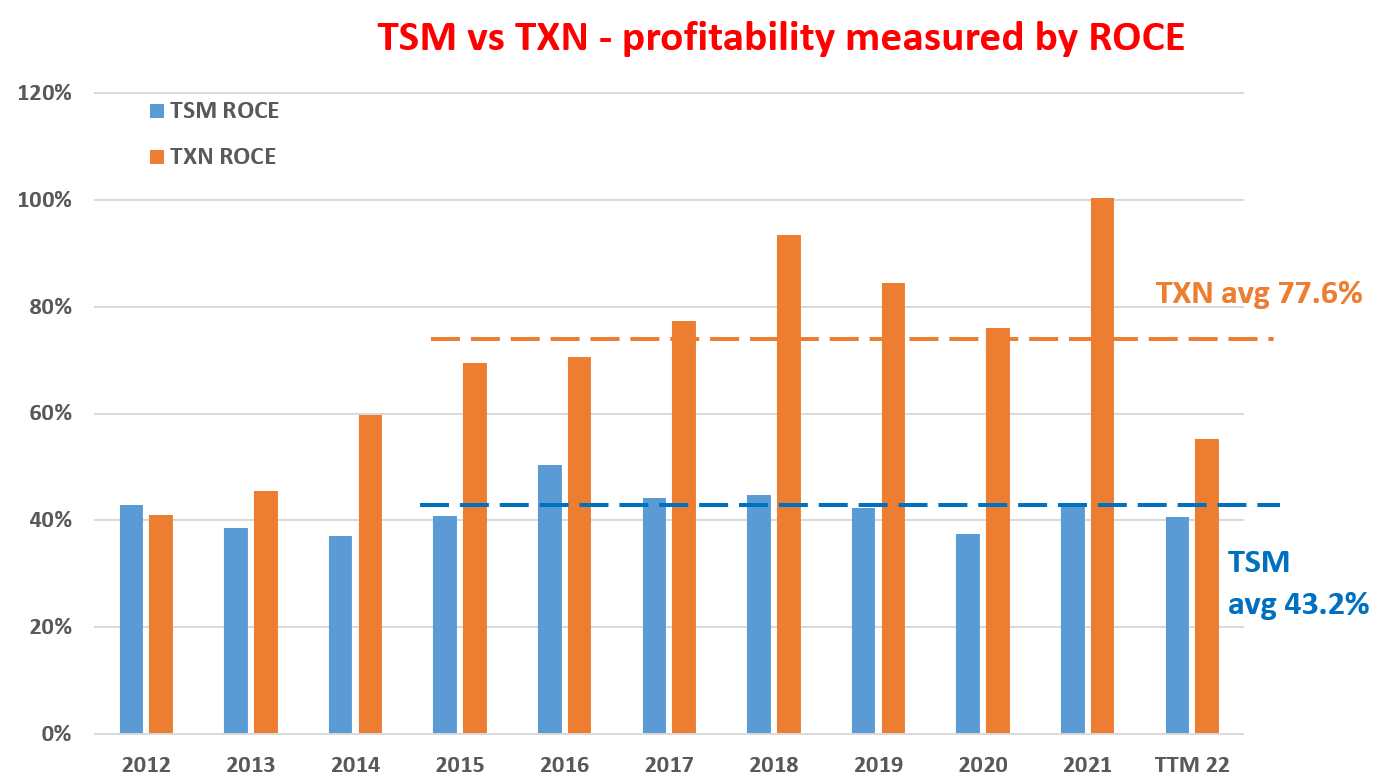
The ROCE of TXN and TSM over the past decade is shown below. As seen, there is no doubt that TSM is a highly profitable business in the past. Its average ROCE hovers around an average of 43.2%. And note the narrow fluctuations, indicating its superb consistency. However, TXN is simply a much stronger business to start with (hence a large part of its valuation premium over TSM is justified anyway even without the CHIPS act impact). To wit, TXN’s average ROCE has been about 77.6% in recent years since 2015, more than 34% above TSM’s average. Again, to provide a reference point, the FAAMG stocks as a group feature an average ROCE of around 55% in recent years.
Next, we will see how the ROCE results in turn impact projected returns.
Source: Author based on Seeking Alpha data
CHIPS Act – Impact on return projections
As aforementioned, the CHIPS act could boost TXN’s profitability both via ROCE (i.e., by expanding its free cash flow) or via reinvestment rates (i.e., by subsidizing its capital expenditures). I will consider the second route only – the increase in its reinvestment rates (“RR”) – in order to prevent double-counting and also to be conservative. And readers can easily confirm that the consideration of the 1st approach is equivalent and would produce the same results.
TXN has been reinvesting at a rate of 10% historically in recent years. And my projection is that the CHIPS act would boost its RR at least by 25% to 12.5%. In contrast, I model the impact for TSM to be negligible, so its RR would remain at 7.5%, which is its historical average.
Now, we can revisit the return projections I made in the thesis section. As mentioned above, for long-term business owners, the return on investment (“ROI”) is the sum of the owner’s earning yield (“OEY”) and the perpetual growth rates. And the key takeaways are:
- TSM offers a more attractive OEY given its valuation compression (9.9% vs TXN’s 5.7%). And the CHIPS act does not directly impact their OEY.
- Although TXN’s total return potential would be on par with TSM (13.5% vs 13.2%) even without the consideration of the act because TXN offers a higher ROCE and higher RR, leading to a higher growth rate than TSM (7.8% versus 3.2%).
- With the act boosting TXN’s RR (or ROCE equivalently), TXN would be able to offer far more attractive long-term return potentials than TSM. As mentioned, I anticipate an effective RR boost of 25% for TXN. So, its long-term growth rates are estimated to be 9.7% (77.6% ROCE * 12.5% reinvestment rate = 9.7%). As a result, TXN’s total return potential is projected to be 15.4% when the impacts of the CHIPS act are considered.
- And since I do not expect the act to benefit TSM’s ROCE or reinvestment rates, there would be no change in TSM’s projected growth rate and return potential. I actually anticipate muted growth rates for TSM due to trade tensions and geopolitical conflicts.

Source: Author based on Seeking Alpha data
Final thoughts and risks
These are some downside risks for TXN and some upside risks for TSM. For TXN, the full impact of the CHIPS act will take a few years to fully materialize. While at the same time, its fab plants will take years to complete and start contributing. For example, the earlier timeline for its four new fabs to start contributing to profits is sometime in 2025. At the same time, TXN also has to compete with domestic players in both the CHIPS and fab space. The CHIPS act may provide help for it to compete against overseas players such as TSM but won’t help too much for it to compete with domestic players. While for TSM, the global chip industry has developed into such a complicated and intricate ecosystem, and TSM’s role in the ecosystem is quite prominent and I don’t expect it to change over a short period of time.
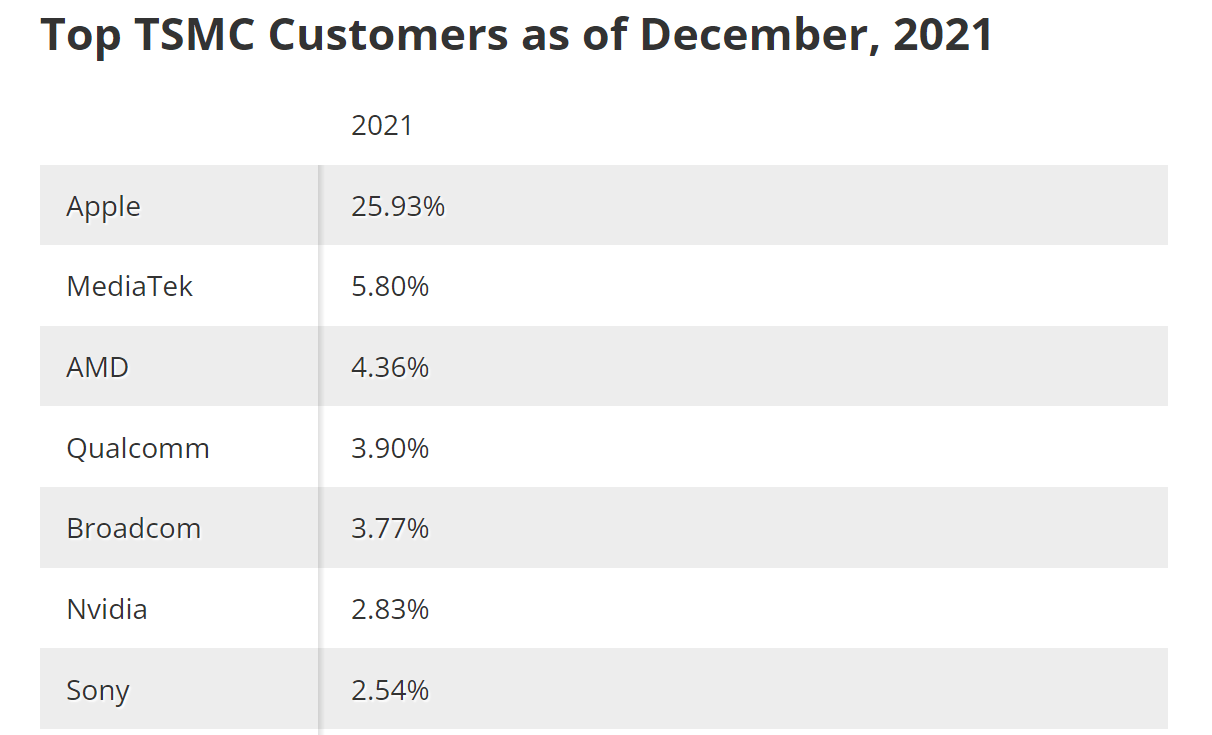
But to reiterate, my main argument is that TSM will face strong headwinds in the long term. And I view the CHIPS act only as the beginning of a paradigm shift for the global chip industry. To make things even worse for TSM, its top clients are almost all U.S. companies as seen in the chart below. Its top client, AAPL, contributes almost 26% of its total sales. MediaTek is the only non-U.S. client among its top 6 clients and only contributes 5.8% of its total sales. Such dominant U.S. exposure creates tremendous concentration risks under the current U.S.-China tensions.
All told, I do not see these risks being properly compensated for despite its lower valuation. As a matter of fact, even before the CHIPS act’s impacts are considered, I see TXN already providing total return potential on par with TSM (13.5% versus 13.2%). And once the CHIPS act’s impacts are considered, TXN would provide a far more attractive return potential (15.4%) than TSM’s 13.2% with substantially lower risks.
Source: Tom’s Hardware