
Rachel Murray/Getty Images Entertainment
In this analysis of Farfetch Limited (NYSE:FTCH), we looked into the company following its announced partnership with Richemont, a luxury goods company. We analyzed the company as it highlighted its focus as a luxury fashion marketplace to determine whether it could benefit from its focus on the luxury market segment by comparing the luxury fashion market forecast growth with the total apparel market. Moreover, we analyzed its market share among its competitors and compared its number of brands to identify Farfetch’s competitive advantages and then forecasted its customer growth. Finally, we examined the partnership with Richemont and analyzed how it could benefit Farfetch’s luxury product mix towards luxury watches & jewelry.
Benefit From Higher Growth Luxury Market
According to the company’s annual report, the company highlighted its focus on the luxury fashion and apparel market.
The Farfetch Marketplace is the largest digital luxury marketplace in the world, connecting two sides of the luxury fashion market: consumers from over 190 countries and territories and luxury sellers in over 50 countries. – Farfetch Annual Report
We examined the market forecast CAGR for the luxury apparel market and compared it to the fast fashion market to determine if the company could benefit from its focus on the luxury market.
|
Market Size ($ bln) |
2021 |
2022F |
2023F |
2024F |
2025F |
2026F |
Average |
|
Luxury Market Size |
80.4 |
91.0 |
103.1 |
116.7 |
132.1 |
149.6 |
|
|
Growth % |
13.2% |
13.2% |
13.2% |
13.2% |
13.2% |
13.2% |
13.2% |
|
Total Apparel Market |
1,550 |
1,631 |
1,716 |
1,806 |
1,901 |
2,000 |
|
|
Growth % |
5.2% |
5.2% |
5.2% |
5.2% |
5.2% |
5.2% |
Source: Statista, Khaveen Investments
Based on the table, the luxury fashion market is forecasted to grow at a CAGR of 13.2% through 2026, which is higher compared to the total apparel market which is forecasted to grow at a CAGR of 5.2% through 2026. Thus, we believe this highlights the superior growth of the luxury fashion market compared to the total apparel market and could benefit Farfetch, which focuses on this market segment.
|
Companies |
Average Order Value (AOV) (2021) |
Revenue CAGR (3-year) |
|
ThredUp (TDUP) |
$47.3 (Mass Market) |
24.8% |
|
ASOS (OTCPK:ASOMF) |
$52.1 (Mass Market) |
12.93% |
|
Farfetch |
$612 (Luxury Market) |
48.63% |
|
Poshmark (POSH) |
$40.0 (Mass Market) |
30% |
|
Mercari (OTCPK:MCARY) |
$96.5 (Mass Market) |
41.7% |
Source: Company Data, Khaveen Investments
To identify which e-commerce platforms focus on luxury fashion, we compared the AOV of selected fashion and apparel e-commerce platforms including ThredUp, ASOS, Poshmark and Mercari. As seen in the table above, Farfetch has the highest AOV per customer of $612 in 2021, more than 6 times that of Mercari, the company with the second-highest AOV of $96.50. Therefore, this highlights that Farfetch focuses on the luxury fashion market while other competitors cater more towards the mass market segment with a lower AOV. Additionally, Farfetch has the highest revenue CAGR of 48.63% among competitors. Thus, we believe Farfetch’s focus on the luxury market segment could benefit its growth with the faster-growing luxury market.
Overall, Farfetch focuses on the luxury fashion market as seen by its higher AOV compared to other apparel e-commerce competitors. We believe its focus on the luxury market segment could benefit the company as it has the highest 3-year revenue CAGR of 48.65% among competitors and we expect it to benefit from the higher luxury apparel market forecast CAGR of 13.2% compared to the overall apparel market at only 5.2%.
Top Luxury Marketplace But Customer Growth Slowing
According to the company’s annual report, the company offers “over 3,400 different brands from over 1,400 luxury sellers, including over 820 of the world’s leading luxury retailers and 590 brands”. To determine whether Farfetch has a competitive advantage over its competitors, we compared the number of brands the company has with its competitors.
|
Company |
Revenue ($ mln) |
Market Share |
Number of Brands |
|
Farfetch |
2,257 |
55.8% |
3,400 |
|
Net-a-Porter (OTC:YXOXF) |
950 |
23.5% |
800< |
|
Tata CLiQ Luxury |
44 |
1.1% |
100< |
|
Gilt |
796 |
19.7% |
5,000 |
Source: Company Data, Khaveen Investments
As seen above, Farfetch has the highest market share among the top selected luxury fashion e-commerce marketplaces including Net-a-Porter, Tata CLiQ Luxury and Gilt. However, the company has the second highest number of brands (3,400) behind Gilt at 5,000. Though, this is because Gilt also has its Home Décor category which accounted for 15% of its GMV.
|
Farfetch Digital Platform Customers (‘000) |
2015 |
2016 |
2017 |
2018 |
2019 |
2020 |
2021 |
Average |
|
Active Consumers |
416 |
652 |
936 |
1,382 |
2,068 |
3,024 |
3,687 |
|
|
YoY Growth % |
56.7% |
43.6% |
47.6% |
49.6% |
46.2% |
21.9% |
44.3% |
|
|
Customer Increase |
236 |
284 |
446 |
686 |
956 |
663 |
545 |
Source: Farfetch, Khaveen Investments
Furthermore, we analyzed the company’s customer growth in the table above. Farfetch’s customer growth rate has more than halved in 2021 compared to the prior year. However, its customer base still increased by 663,000, which is higher than its customer increase from 2016 to 2018 and above the average increase in customers of 545,000.
|
Farfetch Digital Platform Customers (‘000) |
3Q 2020 |
4Q 2020 |
1Q 2021 |
2Q 2021 |
3Q 2021 |
4Q 2021 |
1Q 2022 |
2Q 2022 |
3Q 2022 |
Average |
|
Active Consumers |
2,742 |
3,024 |
3,272 |
3,394 |
3,593 |
3,687 |
3,822 |
3,844 |
3,903 |
|
|
QoQ Growth % |
10.3% |
8.2% |
3.7% |
5.9% |
2.6% |
3.7% |
0.6% |
1.5% |
4.6% |
Source: Farfetch, Khaveen Investments
While its quarterly active customers’ growth had improved in Q3 2022, it had slowed down overall in 2022 compared to the previous years’ quarterly growth rate. According to the Luxury Institute, luxury companies could be experiencing a slowdown among 80% of their customers with the macroeconomic headwinds but stated that this customer group only accounts for 30% of sales and depend on the top 20% of wealthier customers for the majority of sales.
|
Farfetch Customers (‘000) |
2019 |
2020 |
2021 |
2022F |
2023F |
2024F |
2025F |
2026F |
2027F |
|
Active Consumers |
2,068 |
3,024 |
3,687 |
3,975 |
4,483 |
4,992 |
5,500 |
6,009 |
6,517 |
|
Growth % |
49.6% |
46.2% |
21.9% |
7.8% |
12.8% |
11.3% |
10.2% |
9.2% |
8.5% |
|
Customer Increase |
686 |
956 |
663 |
288 |
508 |
508 |
508 |
508 |
508 |
Source: Farfetch, Khaveen Investments
We forecasted the company’s customer base increase in 2022 by prorating its Q1 to Q3 customer increase to obtain a figure of 288,000 customers, which is a growth rate of 7.8% YoY as we expect the company to be impacted by the macroeconomic headwinds on the luxury market. Beyond that, we expect the company’s customer growth to recover and we forecasted it based on its 7-year average customer increase of 508,000 for a 5-year forward average growth rate of 10%.
Expansion Into More Luxury Categories
Farfetch recently announced its partnership with luxury jewelry company Richemont Maisons (OTCPK:CFRHF), which has brands including Cartier, IWC and Panerai, to expand its product portfolio with luxury watches & jewelry.
We believe that the partnership is exclusive as Farfetch is…
acquiring 47.5% of Richemont’s YOOX Net-A-Porter (YNAP) online fashion group.
Furthermore, it was almost mentioned that…
It is anticipated that GMV and revenue generation from the initial stages of the agreement will start to be measured from replatforming YNAP and Richemont Maisons and Richemont brands joining the Farfetch Marketplace (in the second phase) by late 2023/early 2024”.
Farfetch
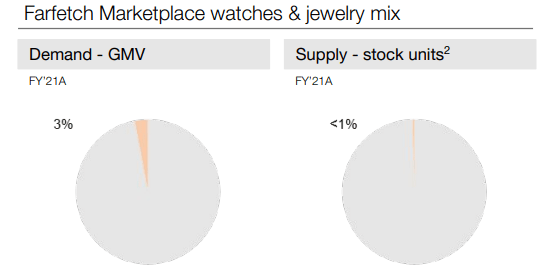
According to the company’s GMV breakdown, Farfetch only has 3% of its GMV from luxury watches and jewelry and it represented 1% of its total stock supply in 2021.
|
Market Size ($ bln) |
2022F |
2023F |
2024F |
2025F |
2026F |
2027F |
|
Luxury Clothing Market Size |
91.1 |
103 |
117 |
132 |
150 |
169 |
|
Growth % |
13.2% |
13.2% |
13.2% |
13.2% |
13.2% |
13.2% |
|
Luxury Watch and Jewelry Market Size |
68.0 |
70.8 |
73.7 |
76.7 |
79.9 |
83.1 |
|
Growth % |
4.1% |
4.1% |
4.1% |
4.1% |
4.1% |
|
|
Luxury Leather Goods Market Size |
66.2 |
70.2 |
74.5 |
79.0 |
83.8 |
88.9 |
|
Growth % |
6.1% |
6.1% |
6.1% |
6.1% |
6.1% |
|
|
Luxury Fragrance Market Size |
14.0 |
14.9 |
15.8 |
16.8 |
17.9 |
19.0 |
|
Growth % |
6.3% |
6.3% |
6.3% |
6.3% |
6.3% |
6.3% |
|
Total Luxury Market |
313 |
329 |
347 |
366 |
386 |
407 |
|
Growth % |
5.4% |
5.4% |
5.4% |
5.4% |
5.4% |
Source: Statista, Khaveen Investments
However, the luxury watches and jewelry market is estimated to represent 21% of the total luxury market. That said, according to Statista, the luxury watch and jewelry market is projected to grow at a lower CAGR of 4.1% compared to leather goods, fragrance and clothing. Still, we believe this highlights the opportunity for Farfetch to expand its luxury product portfolio and benefit its GMV growth given the low % mix of its luxury watch and jewelry segment.
|
Market Share ($ bln) |
Revenue (2022F) ($ mln) |
Market Share |
|
Richemont Maisons |
16.1 |
23.7% |
|
Kering (OTCPK:PPRUF) |
3.9 |
5.8% |
|
LVMH (OTCPK:LVMHF) |
10.1 |
14.9% |
|
Swatch (OTCPK:SWGAY) |
7.2 |
10.6% |
|
Chow Tai Fook (OTCPK:CJEWF) |
14.3 |
21.0% |
|
Others |
15.4 |
24.1% |
|
Luxury Watch and Jewelry Market Size |
68.0 |
100.0% |
Source: Company Data, Khaveen Investments
In the table above, we calculated the top luxury companies’ market share based on our estimated revenues in 2022 by prorating their Q1 to Q3 revenues. With that, we believe Richemont Maisons, which has an estimated market share of 23.7%, would be a great partner for Farfetch as it is the market leader. This is closely followed by Chow Tai Fook and LVMH at 21.0% and 14.9% respectively.
Overall, we believe the partnership with Richemont Maisons could benefit Farfetch’s GMV growth with its low % mix of luxury watches and jewelry at only 3% compared to 21% of the total luxury market. Moreover, we believe this could benefit the company with the strong market positioning of Richemont Maisons at a 23.7% market share.
Risk: Russia Exit Impact on GMV
According to the company in its Q1 2022 transcript, Russia is its third largest geographical market at 6% of its GMV. However, the company highlighted the impact it expects with its halting of operations in the country following the Ukraine-Russia conflict.
By the end of 2021, Russia has grown to become our third largest marketplace market, representing 6% of total GMV and an even higher share of the marketplace, where it posted more than 70% year-on-year growth. Naturally, we expected the continuation of robust growth from this market and our stoppage in Russia considerably in PV GMV growth. – José Neves, Founder, Chairman & Chief Executive Officer
Verdict
All in all, Farfetch focuses on the luxury fashion market with a higher AOV compared to other fashion e-commerce competitors. We believe Farfetch could benefit as the luxury market has a higher market forecast CAGR of 13.2% compared to the overall apparel market at only 5.2%. We forecasted the company’s customer base increase in 2022 by prorating its Q1 to Q3 customer increase to obtain a figure of 288,000, which is a growth rate of 7.8%, as we expect the company to be impacted by the macroeconomic headwinds on the luxury market. Beyond that, we expect the company’s customer growth to recover and we forecasted it based on its 7-year average customer increase of 508,000 for a 5-year average growth rate of 10.1%. Lastly, we believe the partnership with Richemont Maisons could benefit Farfetch’s GMV growth with its low % mix of luxury watches and jewelry (3%) compared to the market which represented 21% of the total luxury market. Moreover, we believe this could benefit the company with the strong market positioning of Richemont Maisons at a 23.7% market share.
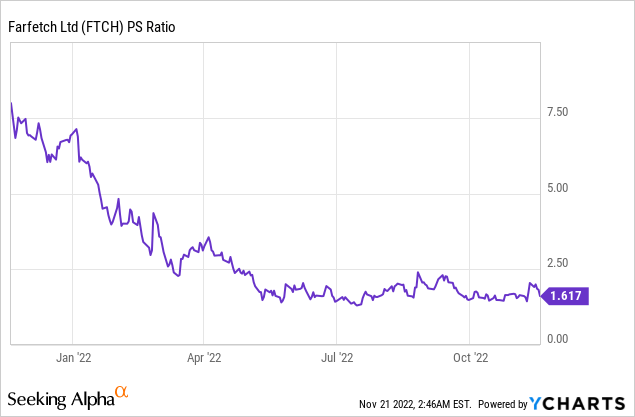
Overall, the company has an analyst consensus price target of $14.31 which is an upside of 76.45%, thus we rate the company as a Strong Buy as the company’s stock price had declined by 82.2% in the past year and its P/S ratio declined by 71% to 1.6x compared to its 5-year average of 5.55x as its growth is expected to slow at 3.41% in 2022 but recover to 17.59% based on analyst revenue consensus.