BanksPhotos
Despite a tumultuous year, gold mining stocks have done their job. As stocks and bonds generally sink –both down more in the double digits percentage points total return in 2022 – the VanEck Vectors Gold Miners ETF (GDX) is off just 8%. That’s a solid 12 percentage points of alpha. One small-cap gold miner features a similar YTD return but also has a bullish technical feature shaping up. Could Harmony provide peace to your portfolio in 2023? Let’s see how well it shines.
Gold Stocks: Highest (Relative) Since June
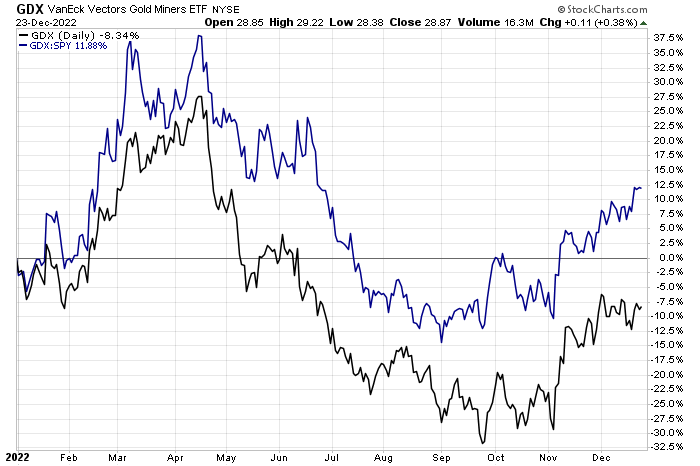
Stockcharts.com
According to Bank of America Global Research, Harmony Gold Mining Company Limited’s (NYSE:HMY) operations in South Africa include underground mines, 1 open-pit mine & tailings retreatment ops. In Papua New Guinea, HAR’s interests include Hidden Valley, an open-pit gold/silver mine, and a 50% stake in the Wafi-Golpu project (Newcrest HMY’s partner). Harmony maintains a hedging program, taking out hedges when at a positive margin, subject to limits: 25% of FX, 20% of gold, and 50% of silver (over the next 24 months). Labor costs are a key risk with the capital-intensive business and with its low margins – a key downside risk to monitor.
The South Africa-based $2.2 billion market cap Metals & Mining industry company within the Materials sector trades at a somewhat high 23.5 trailing 12-month GAAP price-to-earnings ratio and pays a small 0.9% dividend yield, according to The Wall Street Journal. Back in November around its October interim sales release, the firm reported weaker production volumes, but that downbeat news came after a signal of optimism when the firm announced it was buying a project from Eva copper project in October.
On valuation, analysts at BofA see earnings having fallen deeply into the red in 2022, but per-share profits are seen as recovering solidly next year before normalizing in 2024 and ‘25. Being an international firm, dividends fluctuate more with earnings compared to domestic names. ADR dividends, available to U.S. investors, should be under $0.10 annually over the coming quarters.
Using forward earnings estimates, the operating P/E appears exceptionally low around 3.7 while the yield bumps up to 3.3%. HMY trades at a low forward EV/EBITDA ratio and produces impressive free cash flow for its size. Overall, I like the valuation and fundamentals here despite the volatility.
Harmony: Earnings, Valuation Free Cash Flow Forecasts
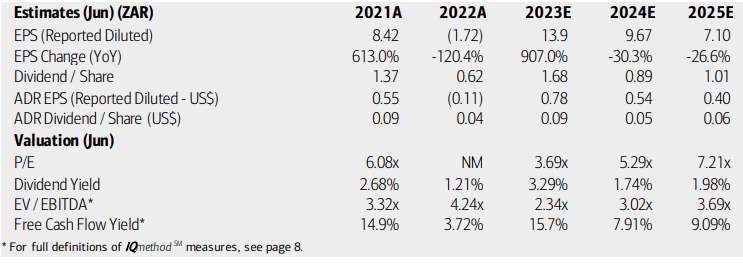
BofA Global Research
Looking ahead, corporate event data from Wall Street Horizon shows a confirmed H1 2023 earnings date of Tuesday, February 28. Before that volatility catalysts, there’s interim production data due out on Friday, February 17.
Corporate Event Calendar
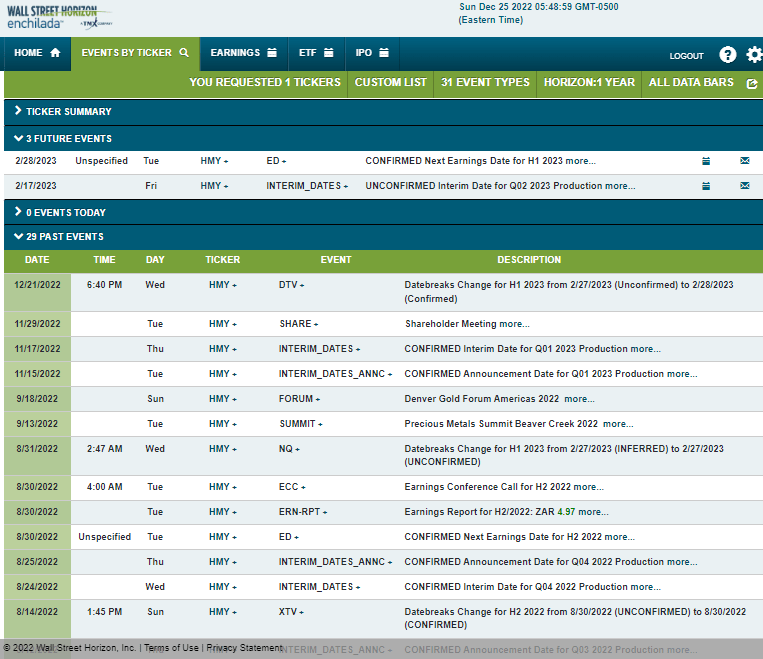
Wall Street Horizon
The Technical Take
HMY appears to be putting in a bullish rounded bottom formation when eyeing the 1-year daily chart. Notice below that shares rallied big off the September low under $2 to nearly $4 in recent price action. I see a bullish cup and handle pattern with resistance near $3.75 – if we can get a close above about $3.90 – which would also be solidly above its flattening 200-day moving average – that would trigger a bullish measured move price objective to near the Q1 2022 highs of $5.50 based on the $1.93 low. You might also call it a bullish inverted head and shoulders pattern.
There’s some work for the bulls as a high amount of shares have traded in the $3.50 to $3.75 area, as measured by the volume by price indicator on the left. Also, a near-term concern is a downtrending RSI line – a breakout from that would draw in more buyers. Finally, take a look at the volume profile – there was a large amount of shares traded around the September low, helping to support the case that it was a solid bottom.
HMY: Bullish Cup and Handle – Watching $3.90
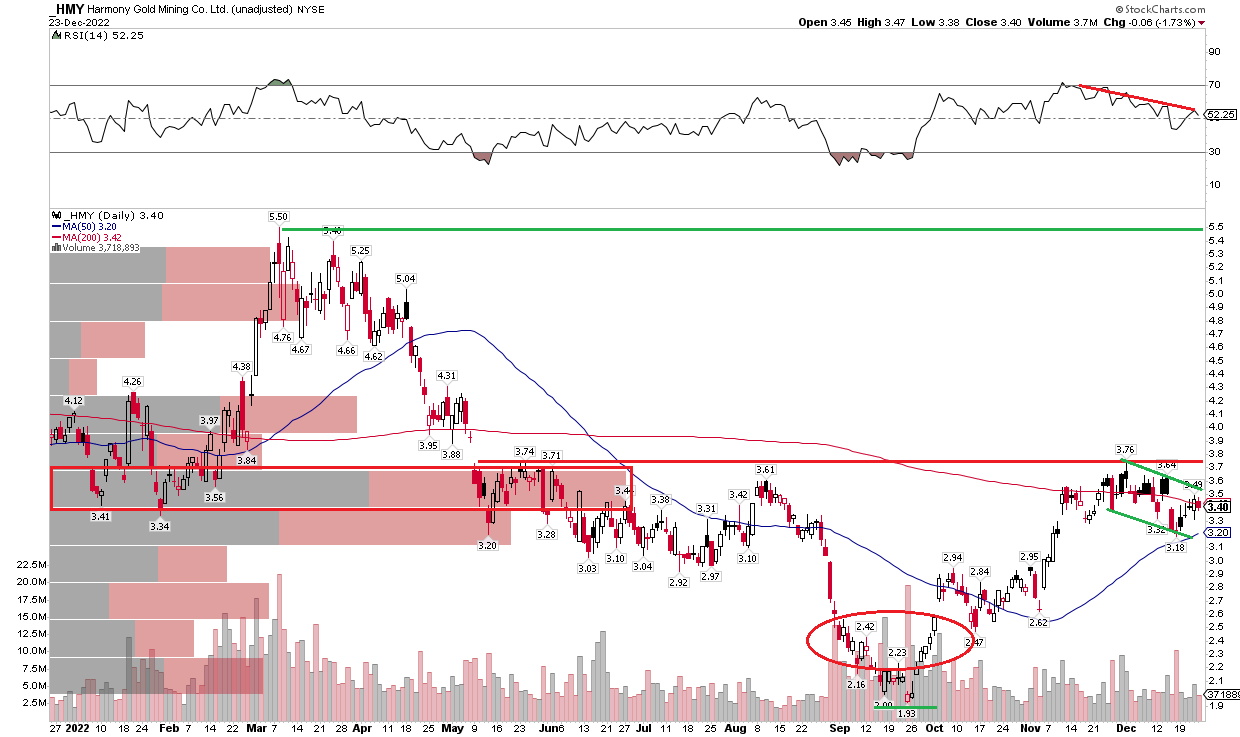
Stockcharts.com
The Bottom Line
I like the valuation situation considering an earnings recovery with Harmony. While margins are a concern with higher labor costs and uncertain gold prices, the technical chart shows a bullish reversal in the making.